


Sunday, November 22nd, 2026
Laramie, Wyoming
By Dan Denning
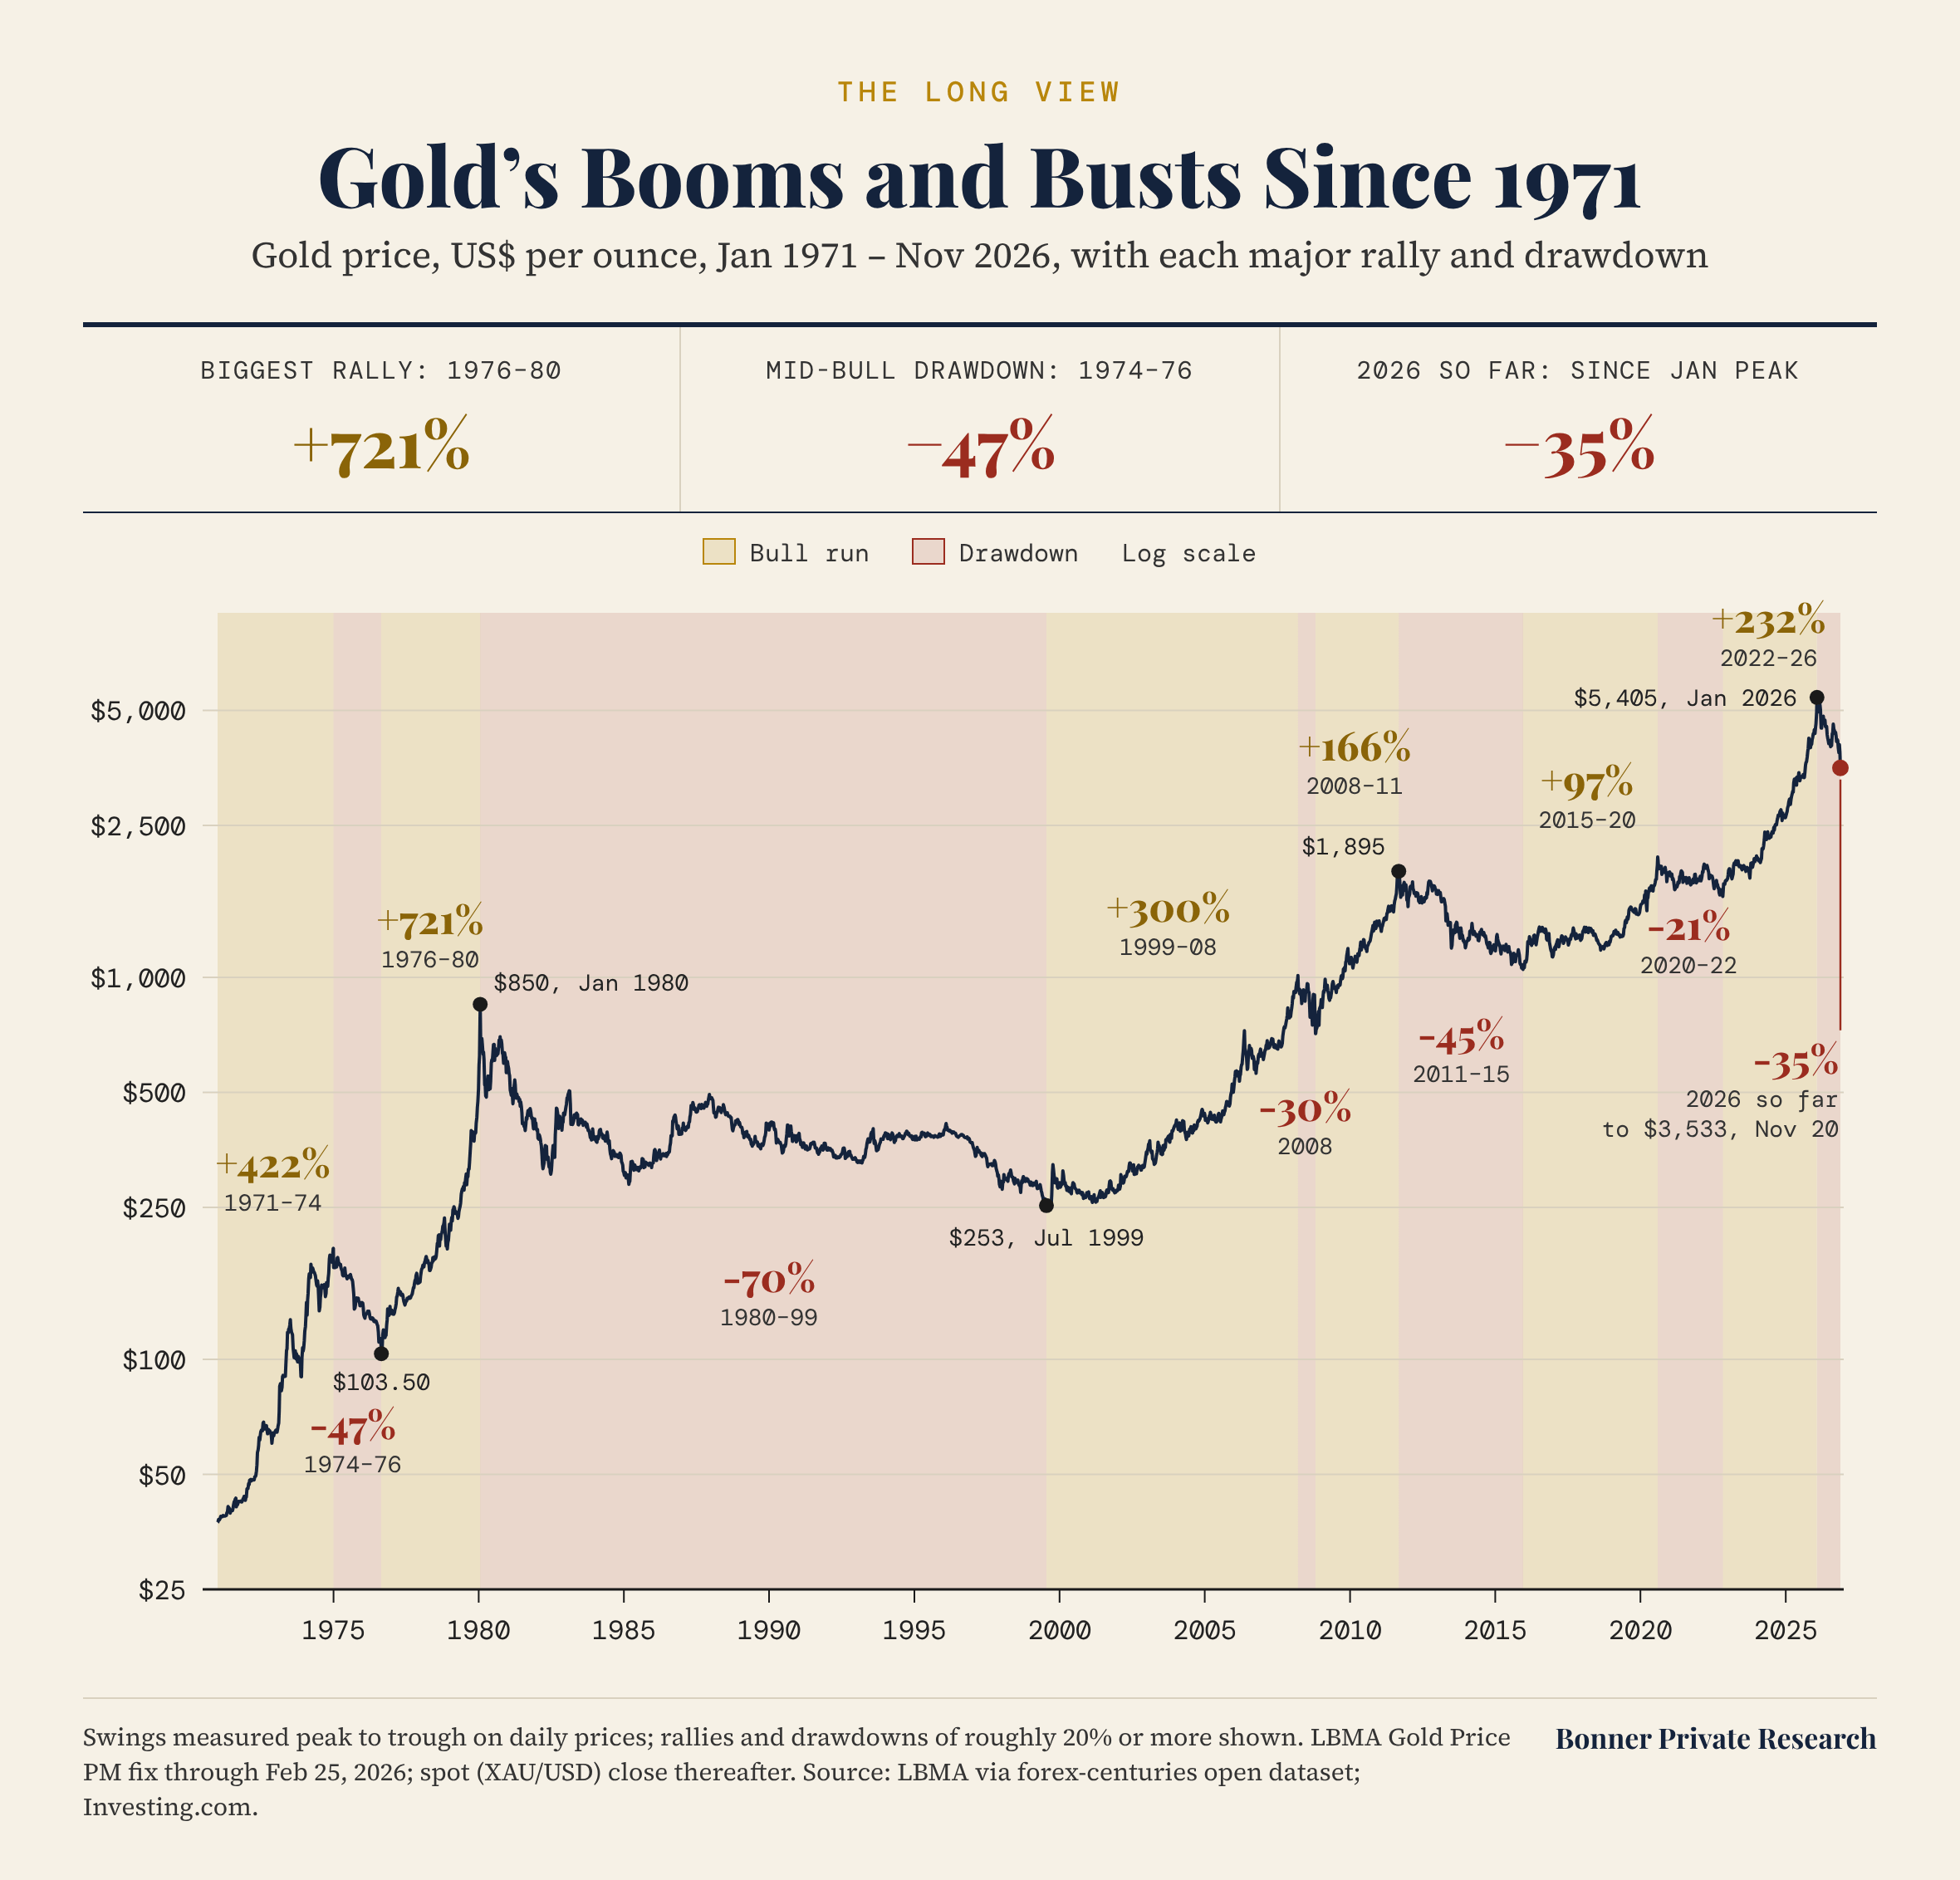
We’re backing up to take the ‘big picture’ on gold after a busy week in BPR. The optimistic view is that we’re in the middle of a grand inflationary cycle like the 1970s where there is plenty of upside left for those late to the party. The less optimistic view?
The mid-cycle draw-down between 1974-1976 saw gold fall 47% peak to trough. After an 8% fall in just three days this week, gold is now down 35% from its all-time high. A perfect replica of the 1970s would imply another 20% fall from here to around $2,860/oz. Worst case, if the next ten months matched the final ten months of the 70s draw-down, you’re looking at a 54% draw-down and gold around $2,500/oz. And then there’s this.
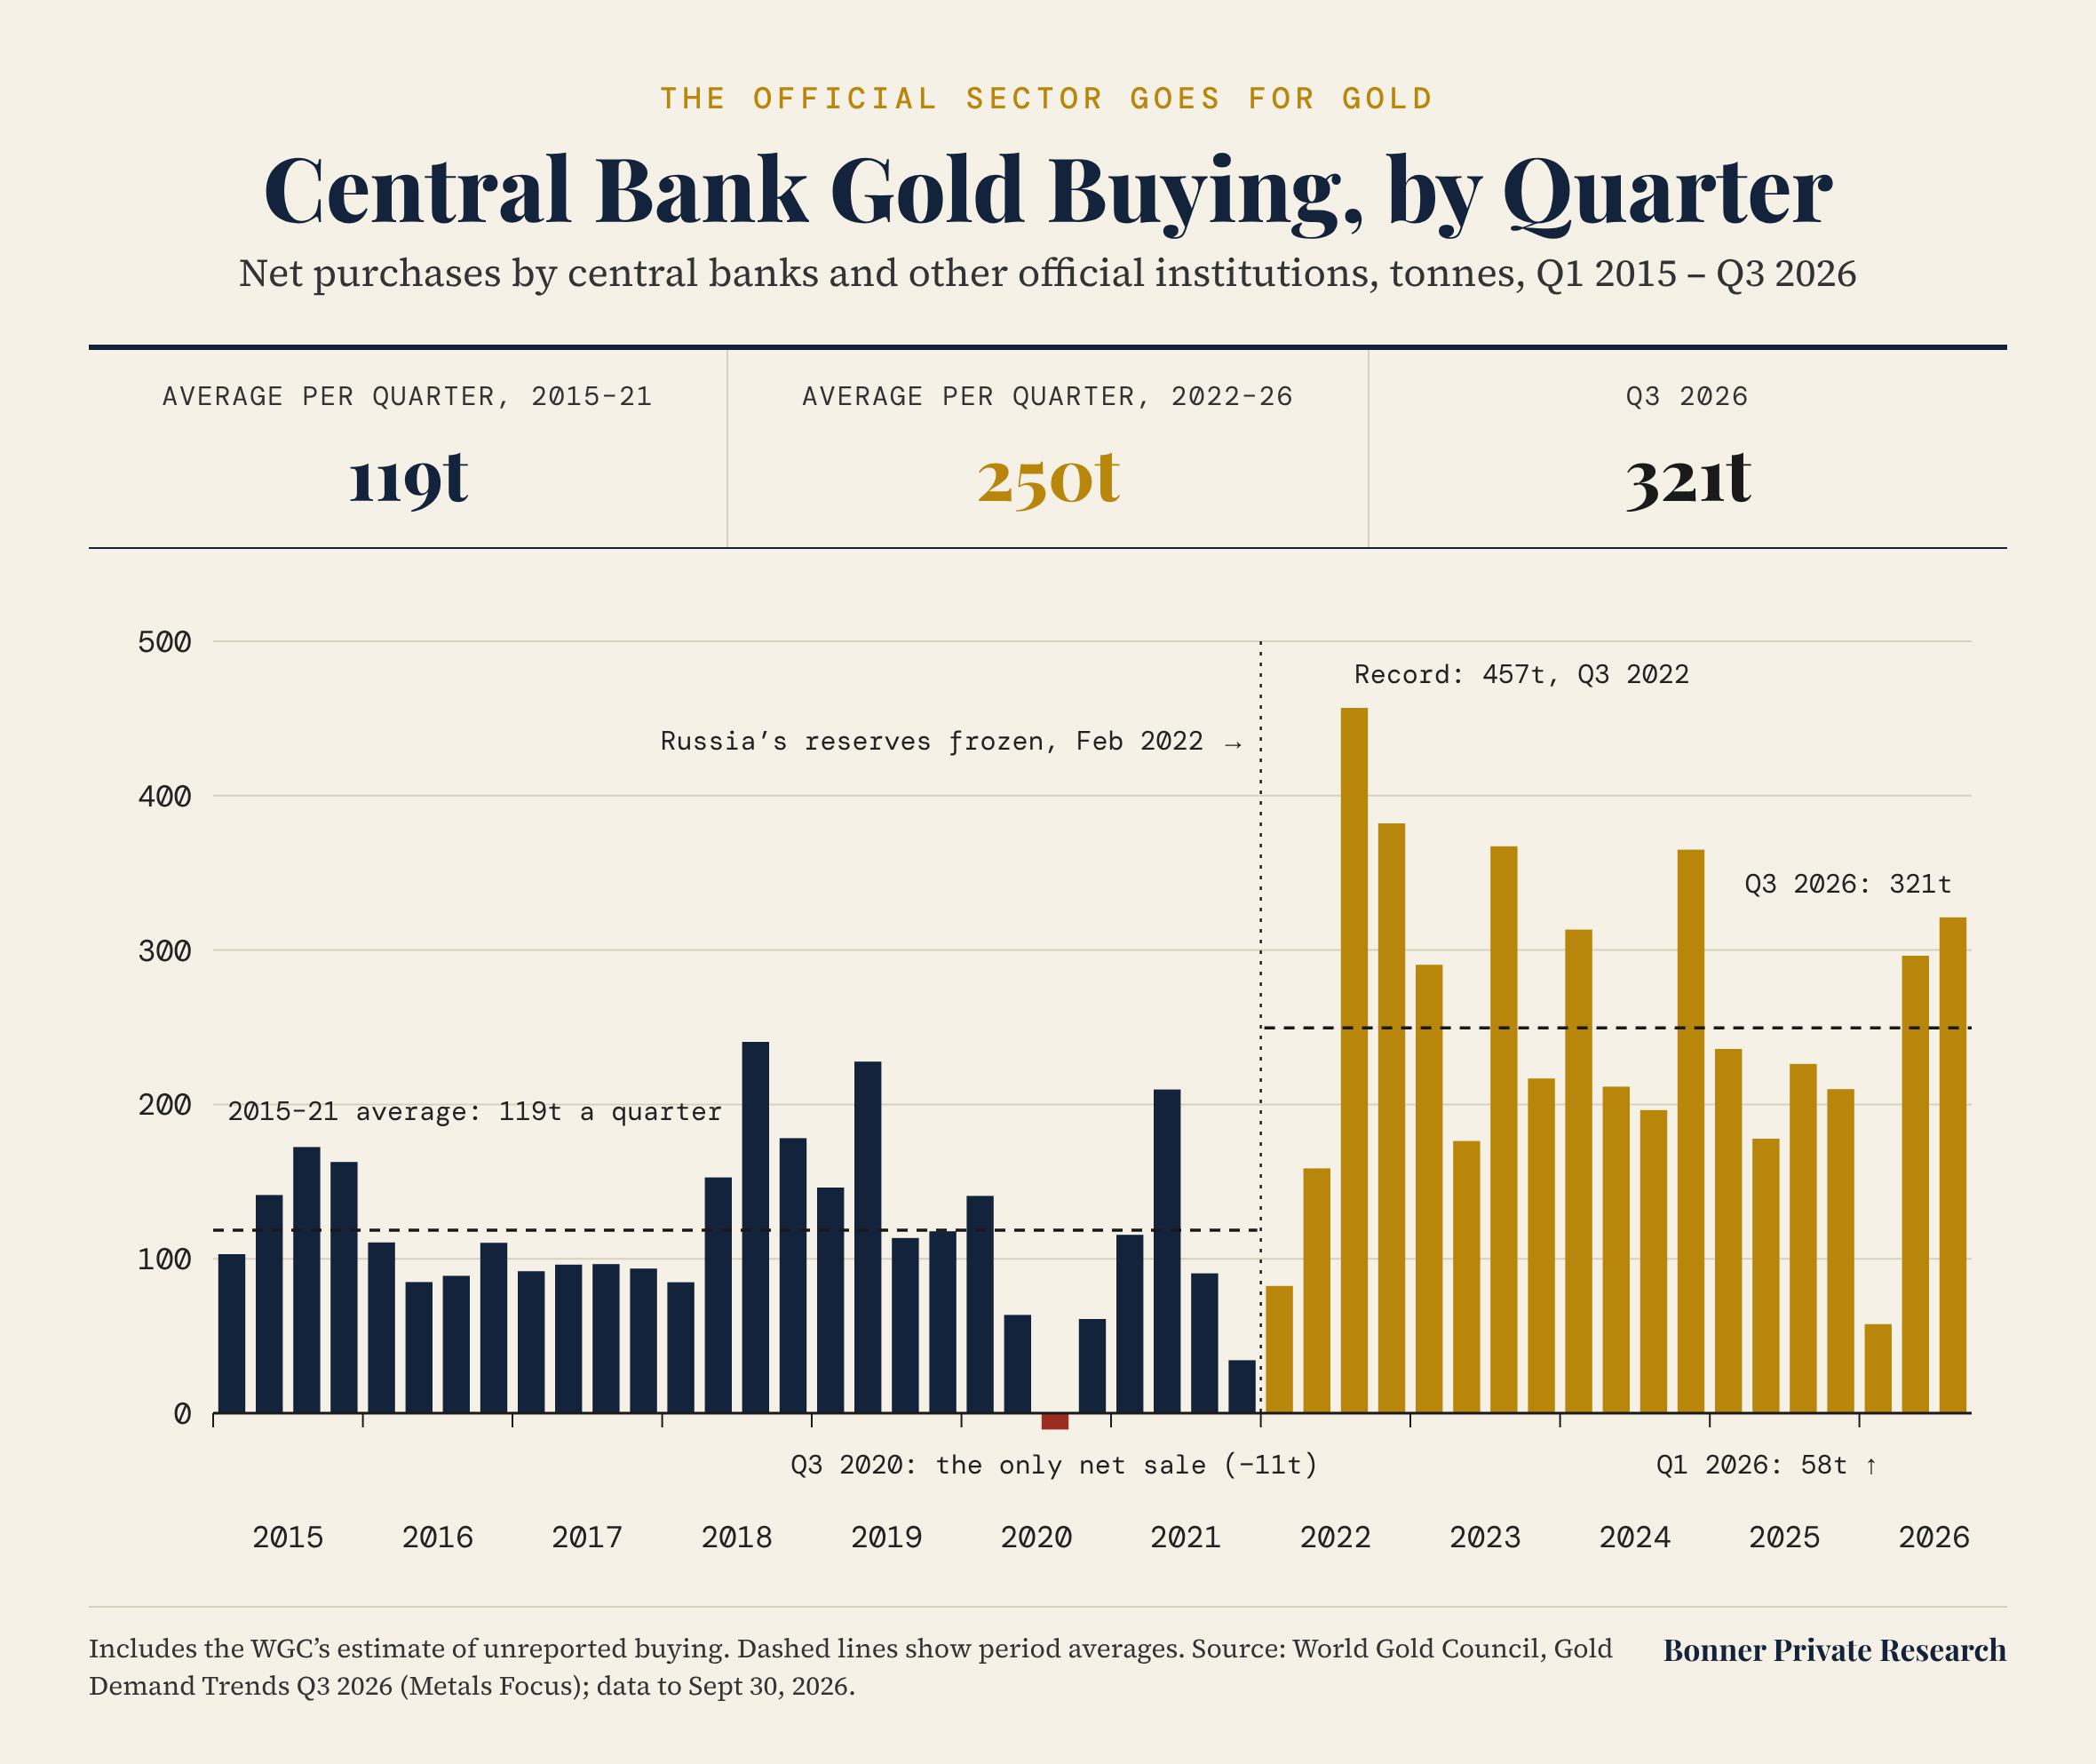
The big move up between 2022 and earlier this year was 232%. It coincided with the beginning of the war in Ukraine. More important, that’s when the US government shot itself in the foot by freezing Russian reserves—a clear signal to central banks around the world that US government bonds were no longer ‘risk free’ as reserve assets.
The chart above shows central bank buying of gold, according to official statistics produced by the World Gold Council. The people who make fake money for a living were buying real money by the bucket-load over the last four years. And today?
Like any liquid asset in a wider draw-down in stocks, gold gets sold. I wrote about the decline in leverage in Friday’s note to paying subscribers (The Leverage is Leaving). There IS price risk in gold. But it’s important to put the price action in the context of the long-term Primary Trend. On that note…
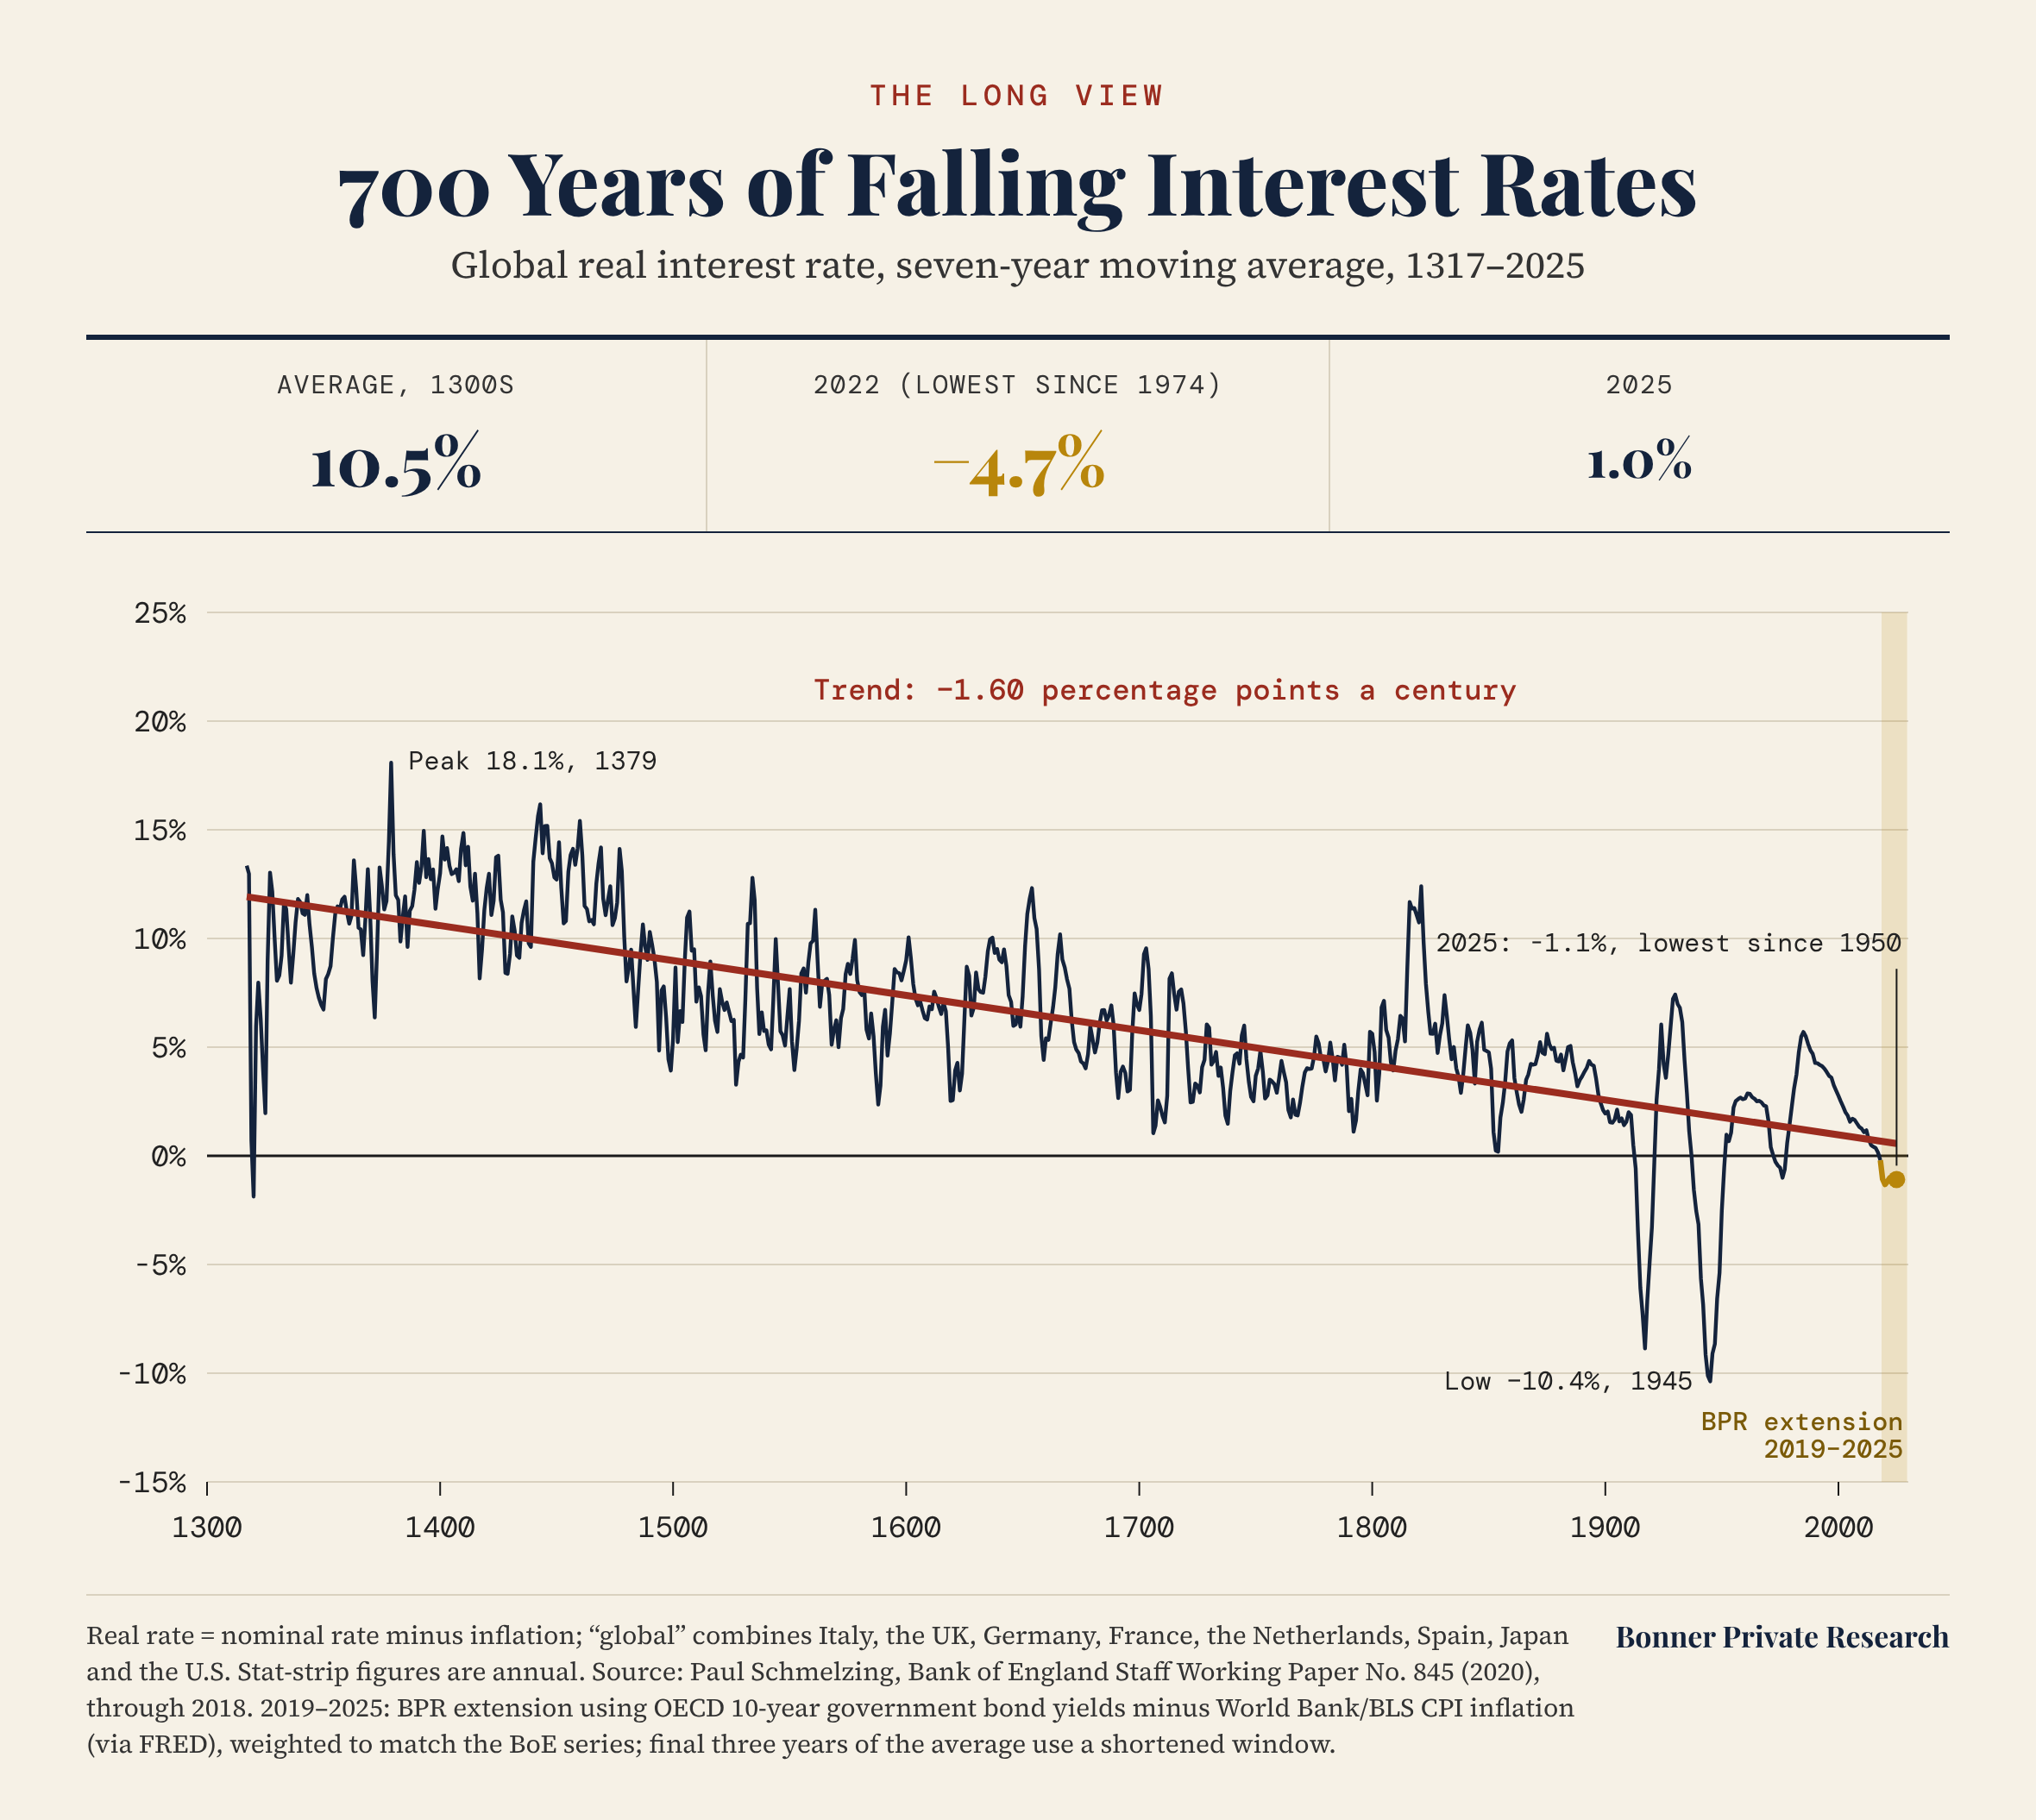
This is an updated reproduction of the long-term trend in ‘risk free’ rates across the world going back 700 years. It’s based on a Bank of England study BPR first wrote about in 2019. The trend—obviously—was down until about 2020. What next?
Gold tends to move down when ‘real rates’ move up. Real rates are what an investor earns after subtracting inflation from the target interest rate (set by the Federal Reserve). The chart shows real rates going negative when interest rates are low and inflation is high. We’ve extended the Bank of England data series from 2018 to today using the 10-year US Treasury yield (slightly different and higher than the Fed’s policy rate).
For real rates to rise, one of two things has to happen. Either interest rates must go much higher or inflation must go much lower (or some combination of both). A major stock-market crash would likely lead to a major recession and lower inflation. On the other hand, it’s hard to imagine the Fed raising rates to crush inflation when the US government has $40 trillion in debt, is running $2 trillion annual deficits, and is already spending over $1 trillion a year in interest payments (on debt that was sold when interest rates were much lower).
Lots of dots to connect! But in the big picture, we’re still in Maximum Safety Mode. Stocks remain historically over-valued. And gold appears to be roughly in the middle of a long-term bull market cycle, which is supported by the direction of interest rates, debt, and central bank buying. Individual investors take note!
Until tomorrow,
Dan
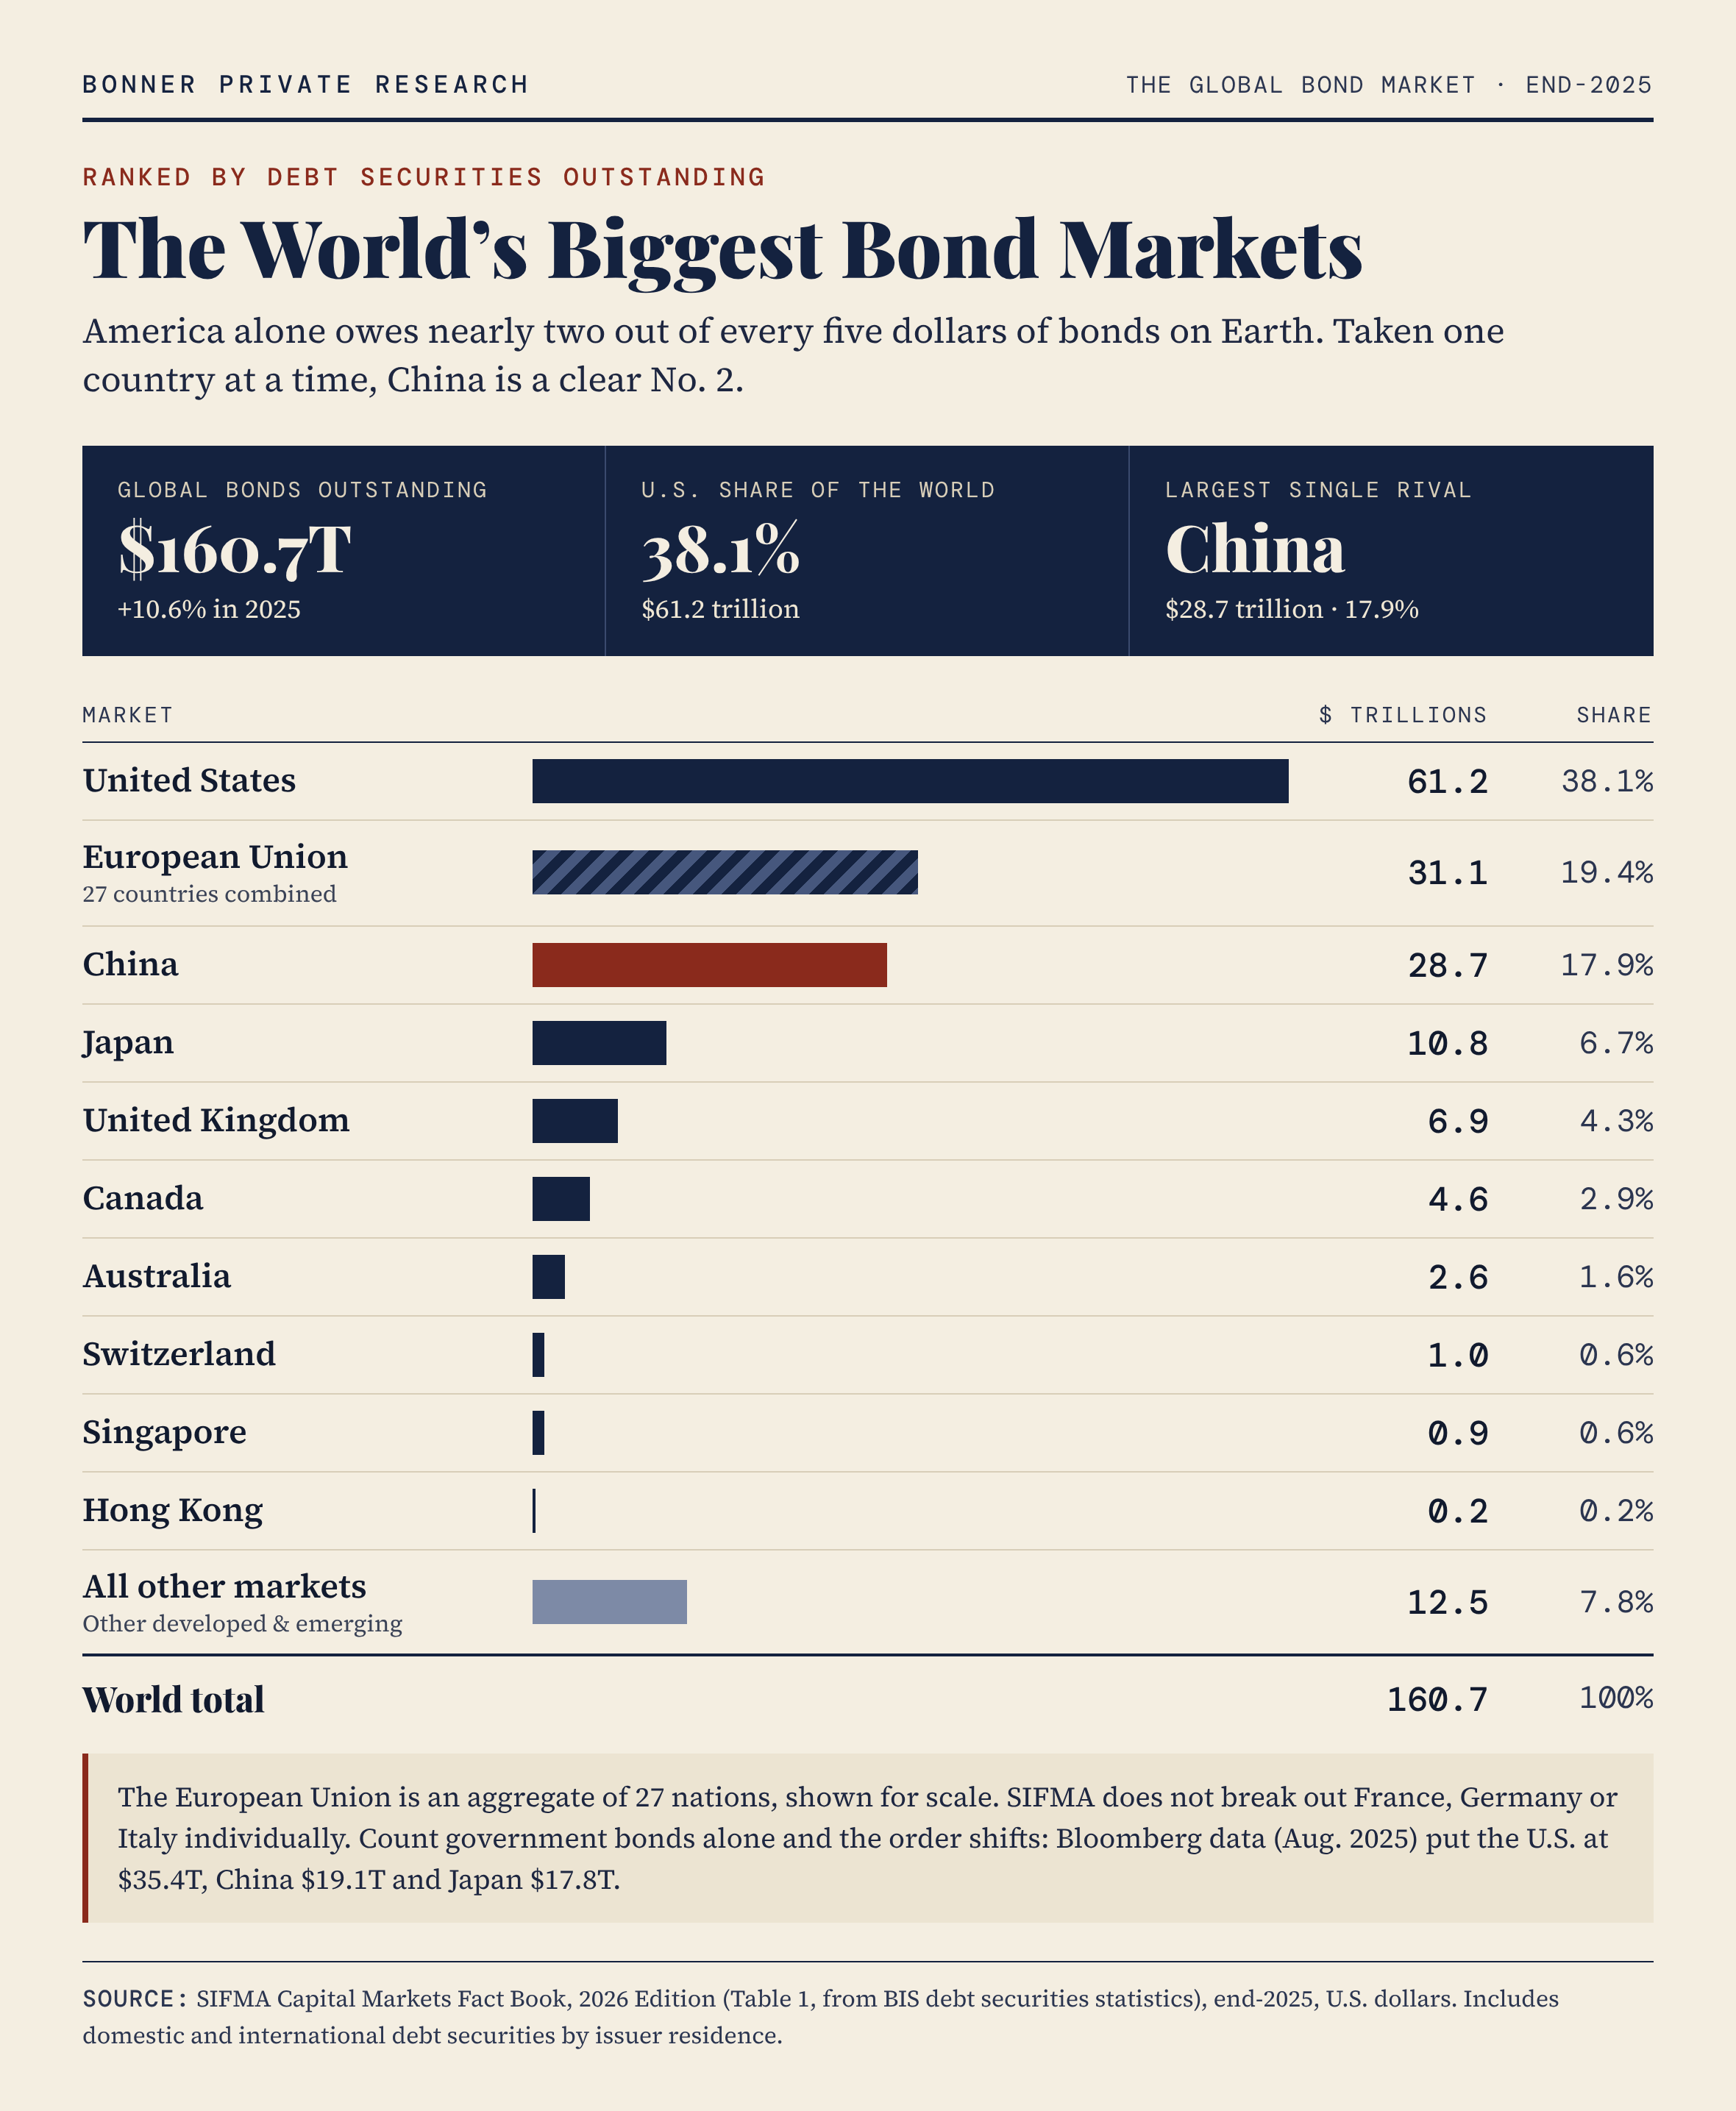
P.S. One factor that makes it almost impossible for the Fed or other central banks to hike rates from here is the sheer size of global debt. The higher interest rates go, the more money borrowers spend on interest. There is also the question of whether that debt generates real growth and income…or results in massive losses when the cap-ex cycle (mostly in AI) goes from boom to bust.


Discussion about this post