What to do when the Fed cuts rates
With CPI growth back to 3% and the unemployment rate trending higher (and triggering the Sahm Rule) we’ve almost certainly entered the next rate cutting cycle in the US.
Chiswick, West London
Wednesday, August 21
By Tom Dyson, Investment Director
A Suezmax oil tanker is currently on fire and adrift in the Red Sea after being hit by two missiles this morning. Suezmax tankers are the second largest class of oil tanker after VLCC. They carry one million barrels of oil. This one is called Sounion and she is owned by Delta Tankers, a large Greek tanker company that owns dozens of vessels. Hopefully she doesn’t sink. We’ll see.
One chart that keeps me awake at night is this one. This is the US Dollar Index [DXY], which shows the value of the US dollar against a basket of foreign currencies. Recently, the US dollar has lost 5% of its value.
We have 40% of our savings in T-bills, which are, of course, just dollars. The dollar already lost some of its purchasing power inside the US. Now this decline in the dollar’s exchange rate represents a loss of purchasing power for our dollars outside the US as well.
I haven’t been too worried about this as we’ve hedged our cash with big positions in gold, silver, platinum, shipping and energy stocks, and these have done very well. We’ve also been earning 5.5% interest on our cash, which has compensated us for some of our lost purchasing power. But it’s looking like this interest rate may not be above 5% for much longer...
On Friday, Fed Chairman Jerome Powell will give his annual speech in Jackson Hole, Wyoming. This is probably his most important speech of the year.
Then, on September 18, Powell will announce the next official policy decision.
With CPI growth back to 3% and the unemployment rate trending higher (and triggering the Sahm Rule) we’ve almost certainly entered the next rate cutting cycle in the US.
The dollar is probably declining because the markets are starting to anticipate lower interest rates on dollar deposits and T-bills.
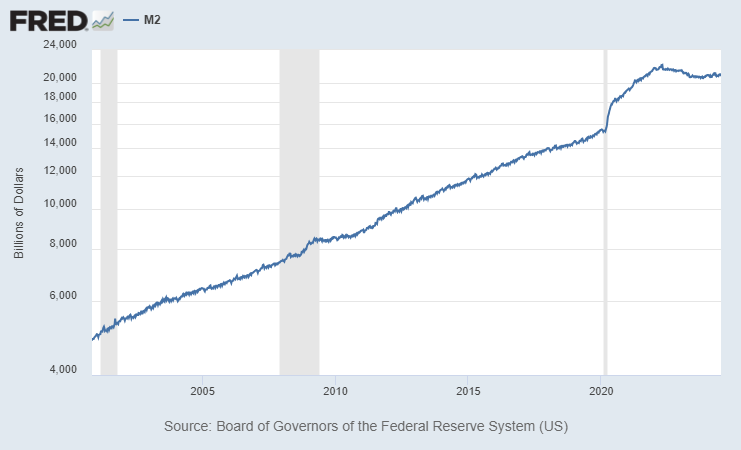
Then there’s this chart… the M2 money supply.
Money supply is the fuel of inflation and dollar debasement. One of the reasons I insisted on us holding a big pile of US dollars two years ago was because I saw the feds choking the money supply growth to fight inflation.
I wanted a hedge against deflation and falling prices. But late last year, the money supply began rising again.
Here’s the same chart zoomed out twenty five years…
The money supply is still rising slowly for now. I’d need to think about this some more before we take any action. But the solution is simple. We’d just have to buy more precious metals and then diversify some of our cash into foreign currencies.
I’m curious to hear what you think about diversifying out of the dollar. Commodities? Foreign currencies? Or even stocks (foreign, US small cap, value?). Leave your comments below.
And let’s keep talking! This weekend, I’m going to host a Q&A thread on the Substack platform. We’ve done this before. You can ask me anything and I’ll reply in the thread (although as usual, please remember I can’t provide personal investment advice). Look for more details from Dan on Friday.
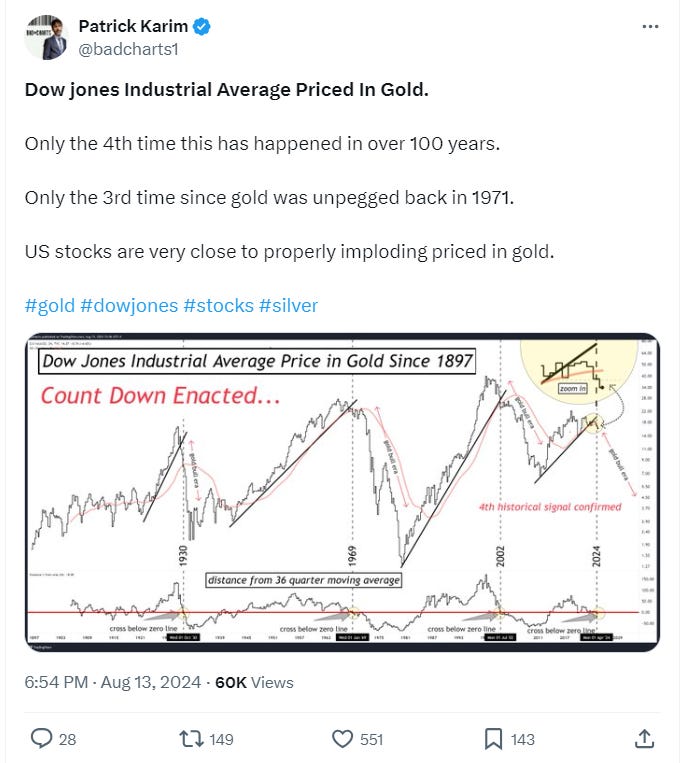
Several readers have forwarded me this long-term chart (above) of the Dow/Gold chart from X. It’s quite a busy chart, so let me explain…
The black line shows the Dow/Gold ratio going back to 1897. You should be very familiar with this chart. We post it in every Monthly Strategy Report. The red line shows the moving average, which is just an ultra-smoothed version of the Dow/Gold ratio.
When the Dow/Gold ratio cuts through the moving average, it indicates the start of a new trend i.e. when the ratio cuts through the moving average from above, it usually marks the beginning of a long down trend. When the ratio cuts through the moving average from below, it usually marks the beginning of a long uptrend.


