

Campo de’ Fiori, Rome
Wednesday, June 10
By Tom Dyson, Investment Director
The stock market has just logged one of the all-time great rallies in history, gaining 19% over nine consecutive winning weeks.
An exciting new technology has sparked a gargantuan capex boom. Suddenly, after years of buying back stock, Google says it wants to issue $80bn in new stock to fund even more AI investment. Meta says it’s thinking of doing the same thing. So is Amazon.
But what’s this? Some businesses are complaining about token costs and telling their staff to limit their use of AI because it isn’t worth the cost. Uber blew through its entire AI budget for the year in just four months. One company — that forget to set a cap on usage — reportedly spent over half a billion dollars on Anthropic’s Claude. Ooops.
Meanwhile, they’re pumping the SpaceX IPO, by far the largest IPO in history.
Suddenly, momentum has stalled. Korea, a momentum leader, has dropped 12% in the last five days. Nvidia, another momentum leader, has dropped 8.6% in the last four days. The Philadelphia semiconductor index, a third momentum leader, has fallen 11% in five days.
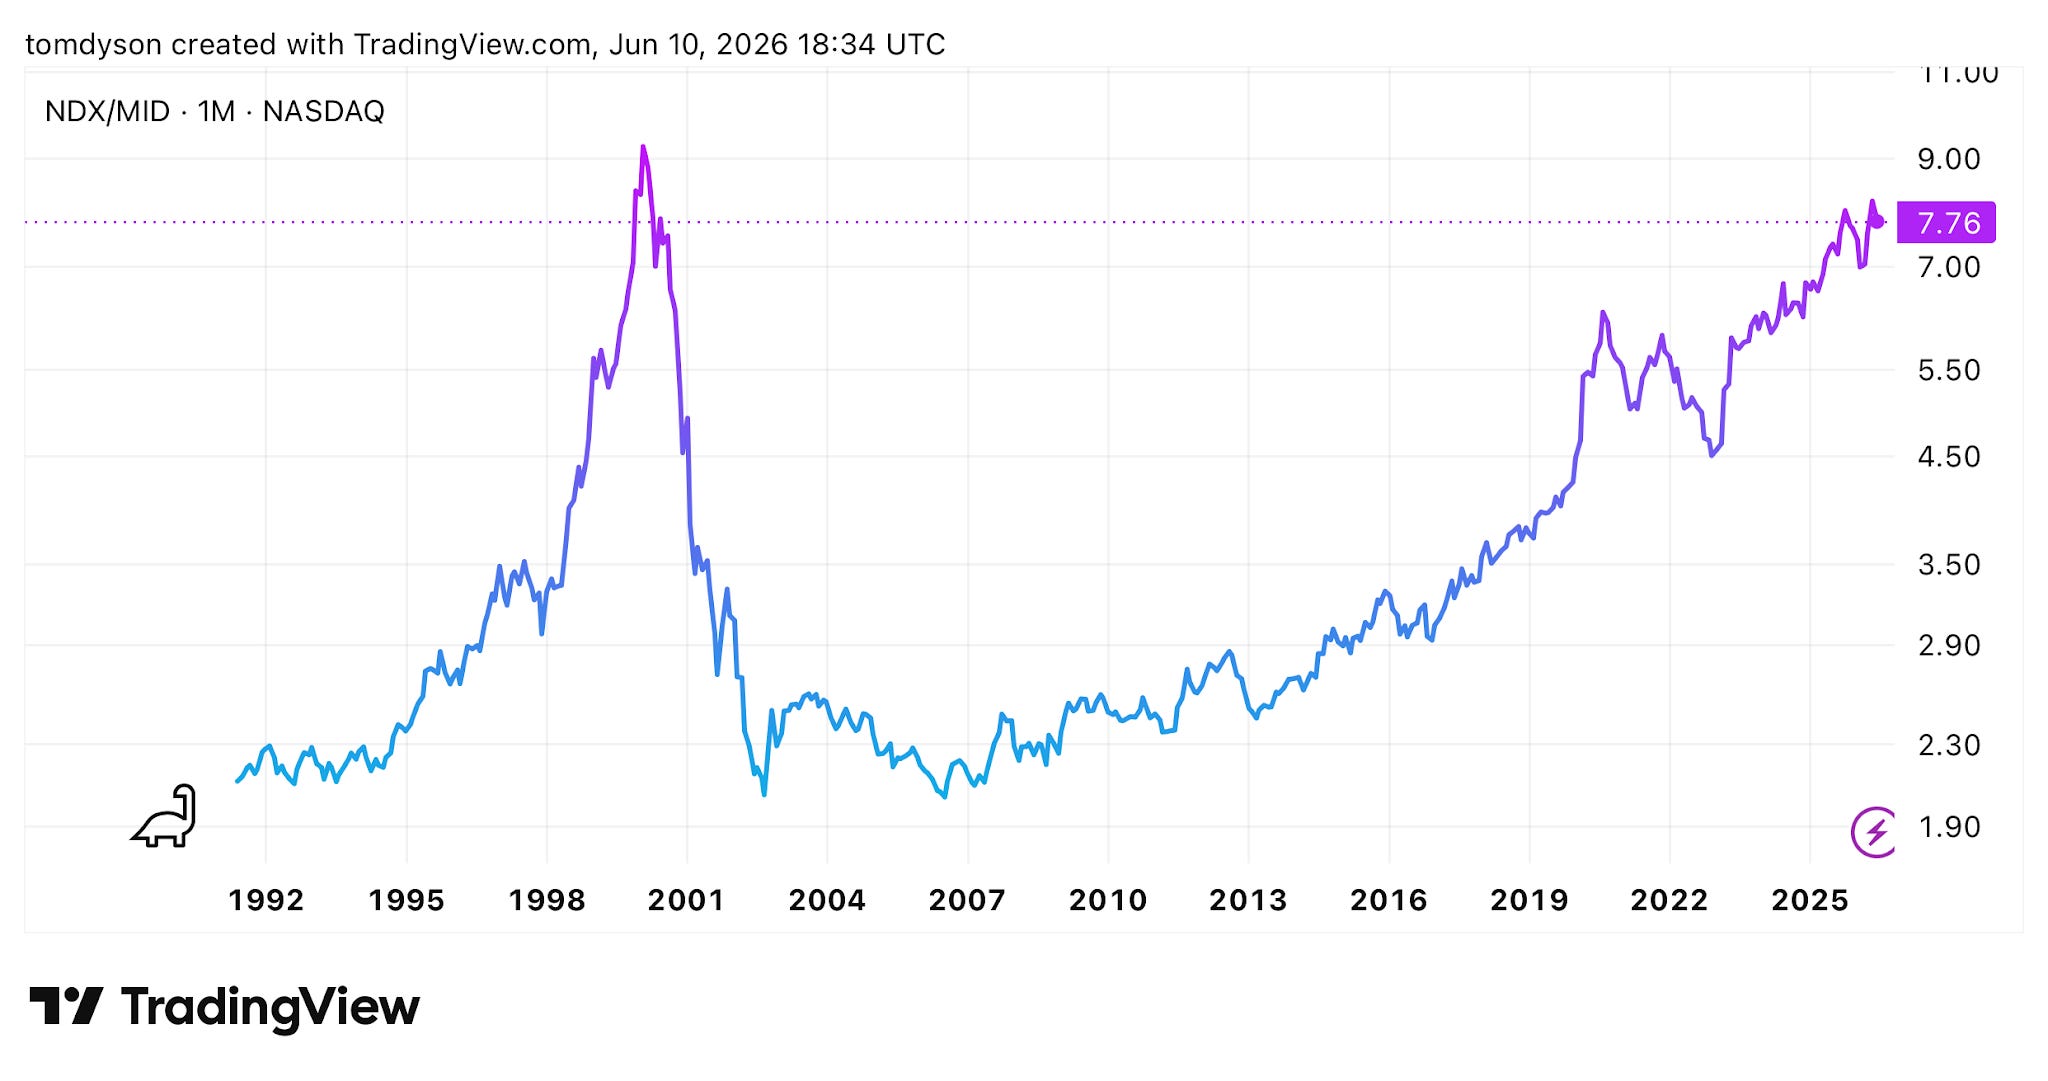
And look at this final momentum leader, the outperformance of the Nasdaq100 versus the S&P 400 midcap index. It’s been one-way traffic for 25 years! It’s down 5.4% since May 29… but the peak still barely registers on this chart.
Oh…and interest rates are rising, which is a stiff headwind for growth investing. And the Strait of Hormuz is still closed.
In short, I couldn’t be more bearish. This is a classic stock market bubble in search of a pin.
Greetings from Rome!
They tied his tongue and then burned him at the stake.
This is Giordano Bruno. He believed Earth rotated around the Sun and the Universe was infinite. He was arrested by the Inquisition, and spent seven years on trial being tortured. They gave him many opportunities to recant his theories, even right up to the end when the flames were licking his feet. He still refused. So they gagged him for the last time and let him burn.
This is the exact spot where they executed him, 426 years ago.

Let me show you the simple guide I’m using to imagine what comes next for the stock market…
This chart shows the S&P 500, adjusted for inflation, going back 150 years.
The red lines show the bear markets…the long stretches where the stock market didn’t generate a positive return.
I assume that the S&P 500 will return to the uppermost red line on this chart (at 3,038), probably right where those three question marks are (sometime in the early 2030s).
As the red lines show, it would not be surprising for those buying the S&P 500 at today’s levels to be waiting four or five decades to see a positive return on their investment.
Overly simplistic? Maybe. Unorthodox? For sure. Contrarian? Extremely.
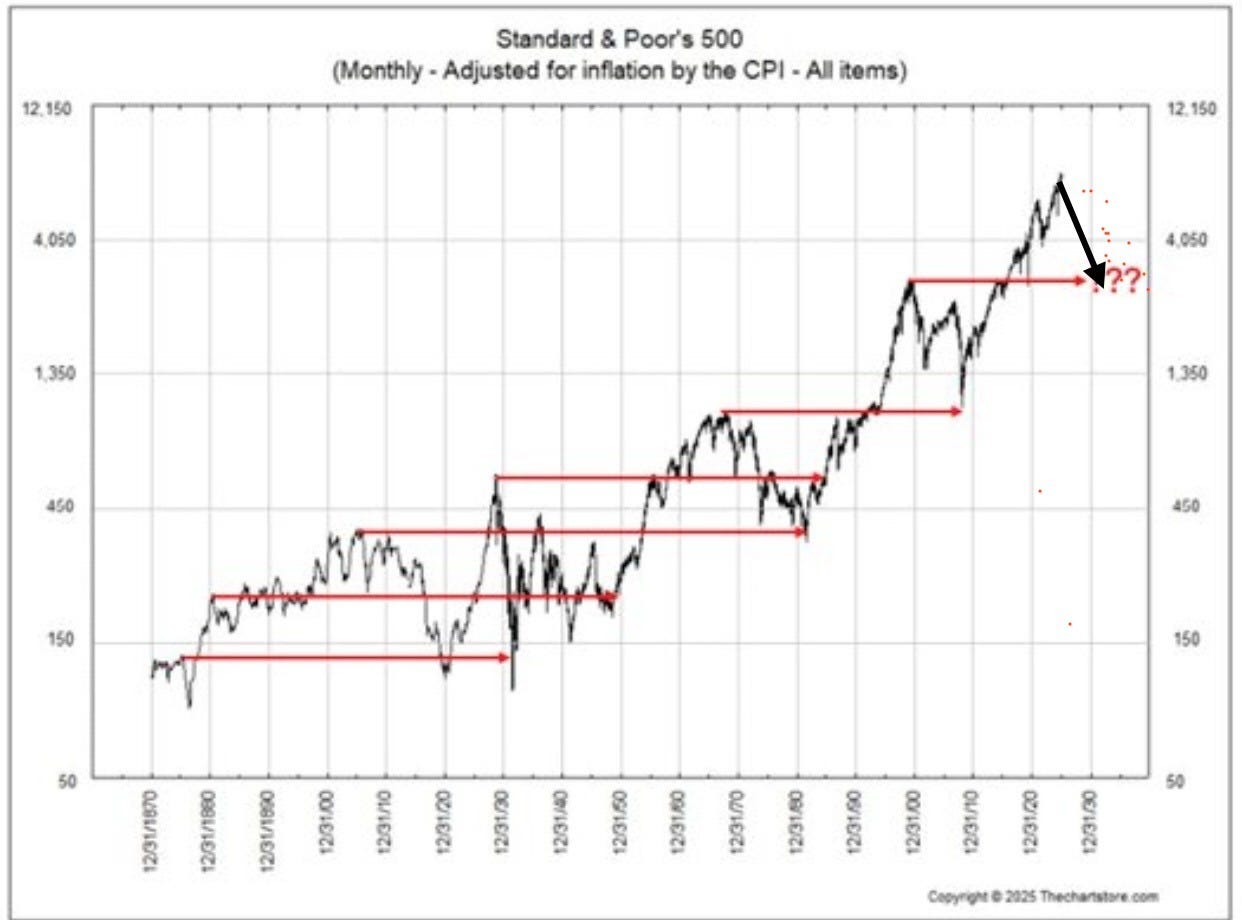
Source: Dave Collum’s Year In Review 2025
Our current asset allocation is like two separate bets against the stock market. Holding cash is a direct bet against the stock market and falling prices. We have 35% of our savings allocated to cash.
Precious metals and cheap energy stocks are also a direct bet against falling stock prices, and a devalued paper currency. History shows that when stock market values mean revert, gold and other hard assets soar.
I’ve also been thinking a lot about placing a third bet against the stock market…either by selling short or by buying long-dated put options.
I’m meeting up with Dan and Bill in London later this month and I’m going to seek their counsel. For now, I feel it’s a bad idea. Why? It’s game theory. If our two existing bets against the stock market pay off — and the Dow/Gold ratio goes to 5 — we’ll end up making a fortune.
The additional impact of buying put options or short selling seems like unnecessary risk for no clear gain.
