

Friday, September 4th, 2026
Laramie, Wyoming
By Dan Denning
Imagine a brief but violent civil war in the next twenty six months. A ‘benevolent dictator’ takes power as the war ends. He (or she) seizes on the national emergency to make sweeping economic and constitutional changes to America as we know it. Everything changes.
A wealth tax is introduced. Social Security benefits are means tested (and the cap on taxable earnings is lifted from $184,500 to $1 million). Universal Basic Income (UBI) and a Central Bank Digital Currency (CBDC) become compulsory for the receipt of government benefits and all transactions (both sold as technological solutions to welfare fraud and illicit cash profits and tax evasion).
The Supreme Court is expanded from nine justices to thirteen. Three new states (Guam, Puerto Rick, and DC) are admitted to the Union, adding six new members to the US Senate. The debt ceiling is abolished. So is the filibuster in the Senate.
Sounds far fetched?
What if I told you a radical revolution very much like that already happened in America? And it didn’t even take a civil war to bring it about. Yet it resulted in the greatest expansion of Federal power (and loss of personal and economic liberty) since the Civil War.
It led directly to to America’s involvement in the Great War, ensnaring the US in more than 100 years of endless wars costing trillions of dollars, ‘paid for’ with huge debts. Could something even worse happen again? Could the country survive it this time? Could you? More on all that shortly. But first…an important chart this week.
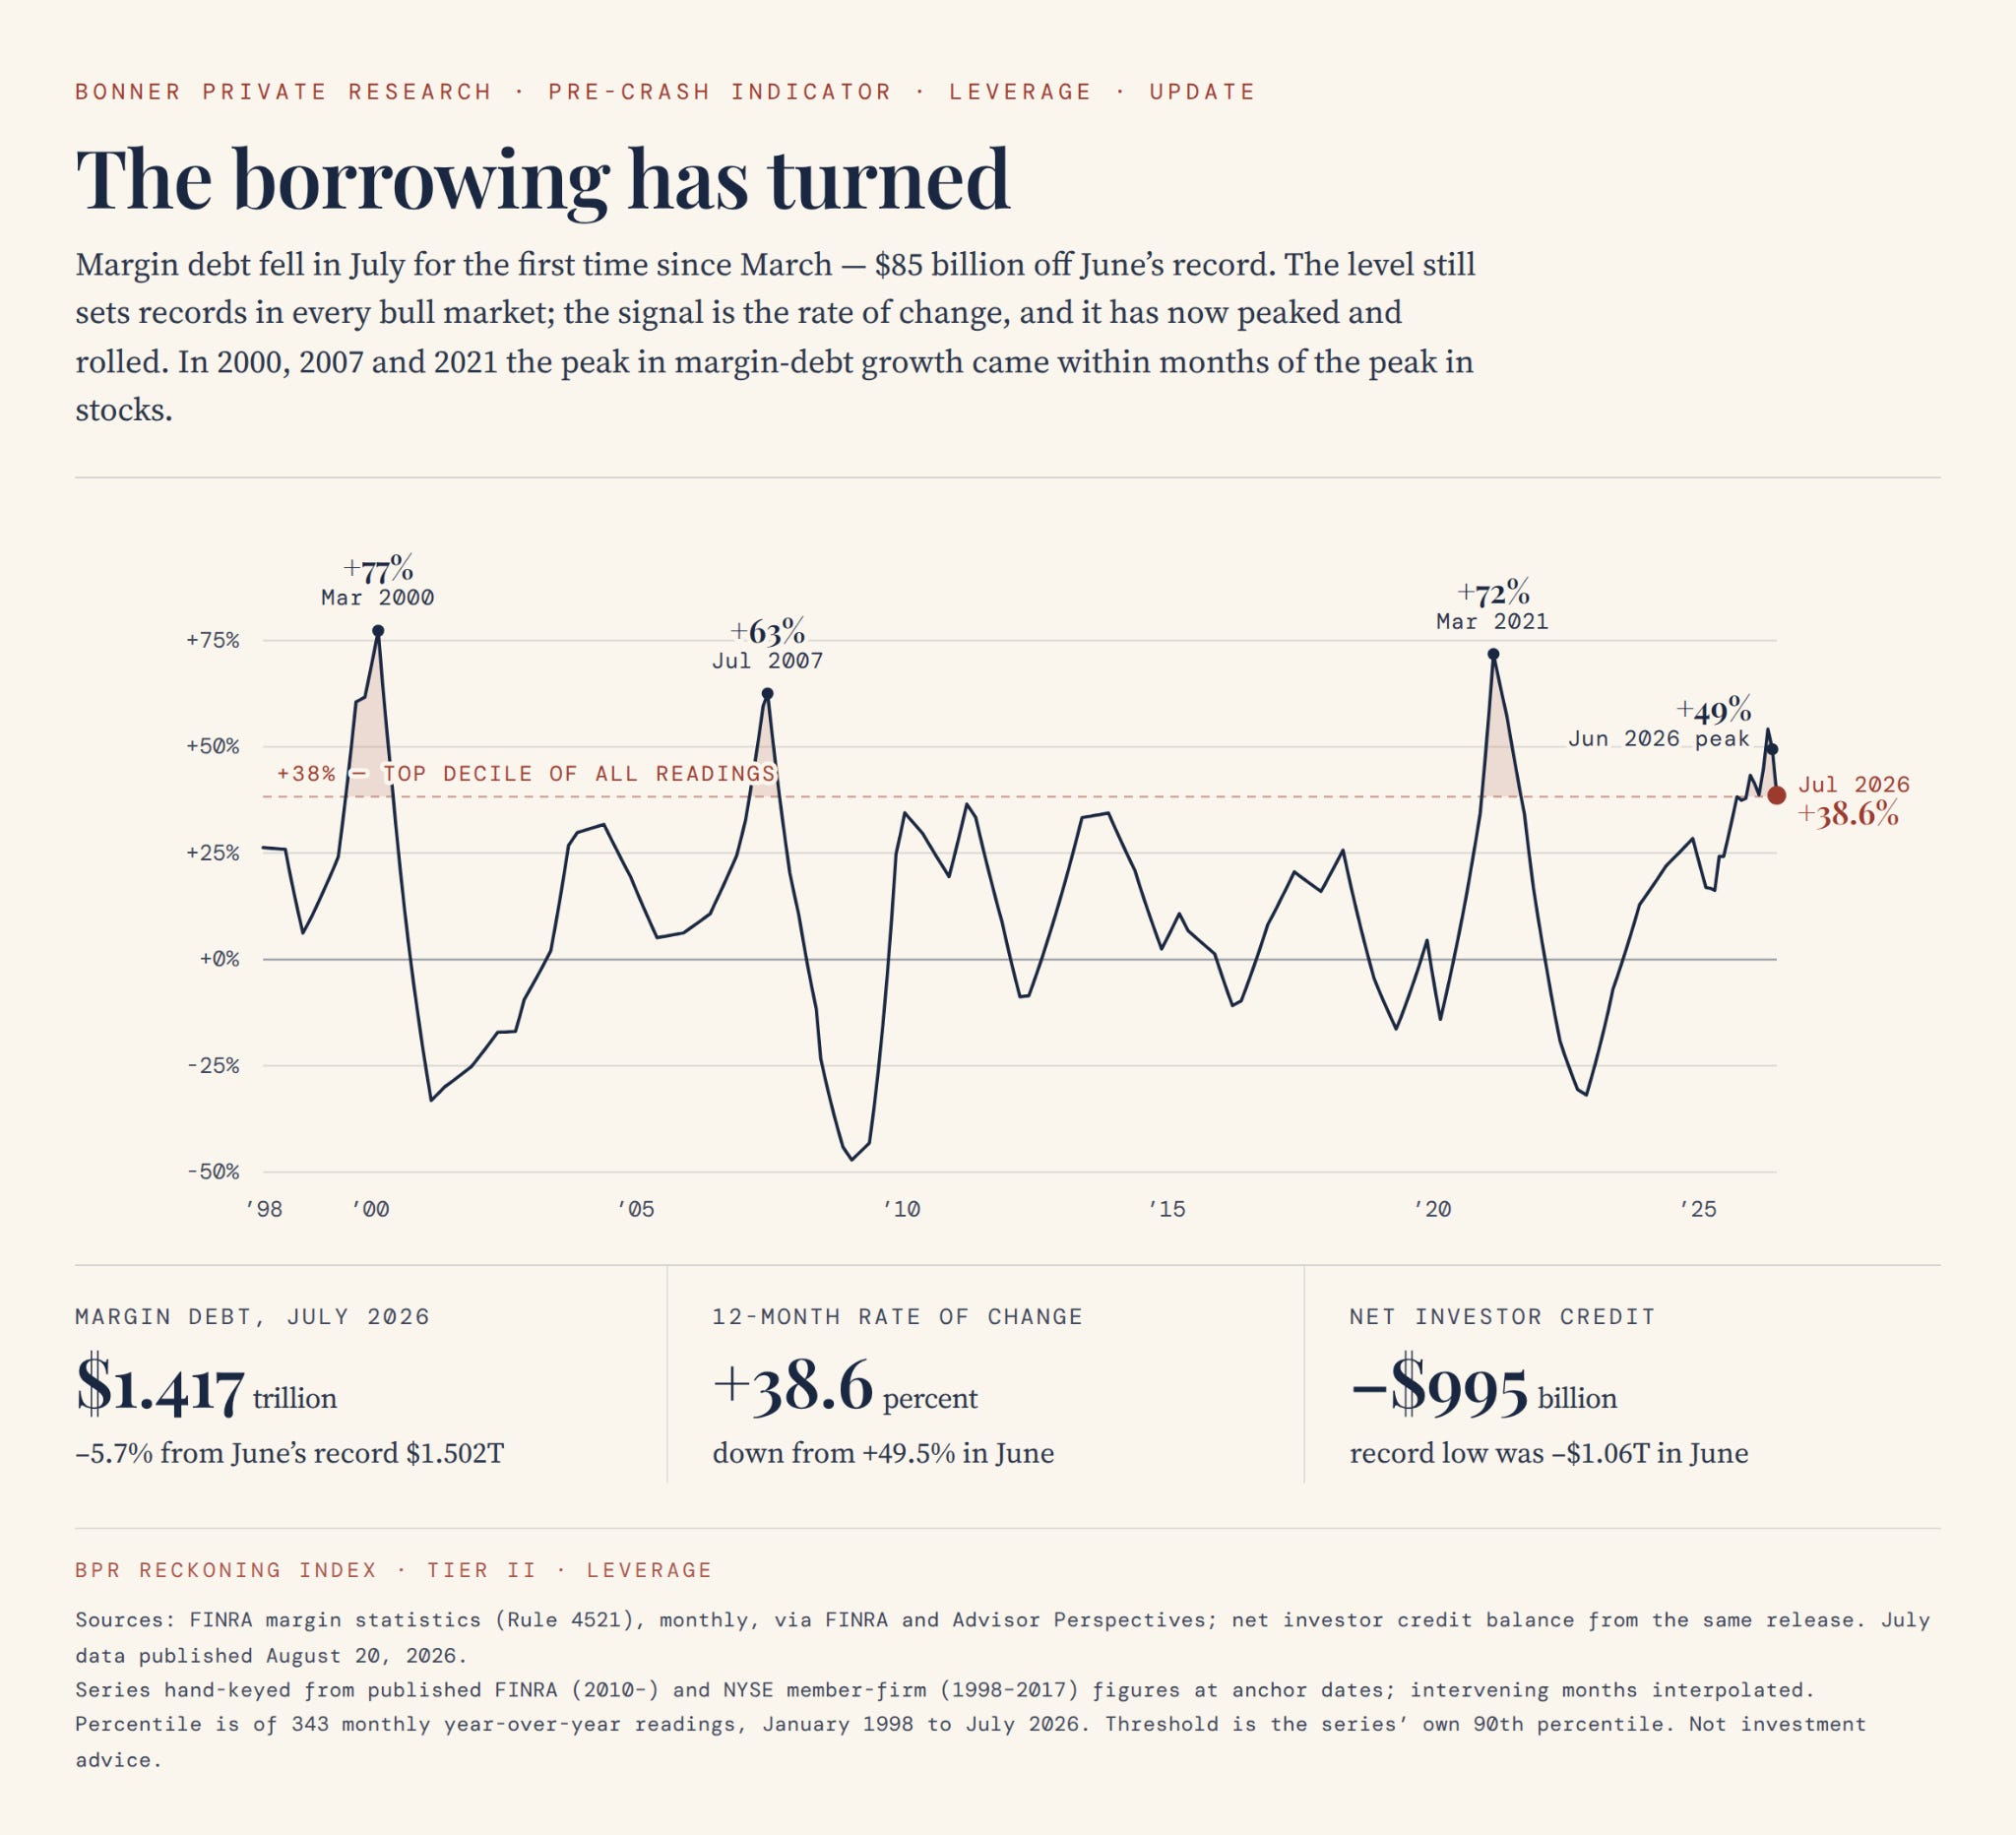
In late July, we added five ‘Pre Crash Indicators’ (PCIs) to our BPR analytical tool box. These were on top of the valuation metrics we regularly track month-to-month. We added the five PCIs in an attempt to better pinpoint WHEN the market might start mean-reverting back to the valuations our metrics tell us are inevitable. This week, telling news on one of the PCIs.
Margin debt may be rolling over. This happened in 2000, 2007, and 2021 before big falls in the stock market. A change in the appetite for leverage is a change in expectations for future stock returns. Is that what’s really going on? First the numbers.
Margin debt is when an investor borrows money from a broker to buy more stocks. The collateral for the loan is the value of the investor’s portfolio. It’s free money to change your life, as long as stocks keep going up. When you’re worried they might not go up as fast—or, ye gads, might go down–you quit borrowing (and maybe start selling).
In June, margin debt peaked at $1.5 trillion. That was an all-time high. The year-over-year rate of change was 49.5% (that’s what you see in the chart above). The official July number was $1.41 trillion, a decline of 5.7% from the June high. The rate of change slowed to 38.6% year-over-year.
Borrowing less fast. Is this the great roll over before a bigger decline? It’s too soon to say. And it’s only one of five ‘Pre Crash Indicators’. But it’s the same trend we saw prior to the last three big mean-reverting down moves in the markets. If investor expectations about the next ten years of returns are changing, why? Next chart.
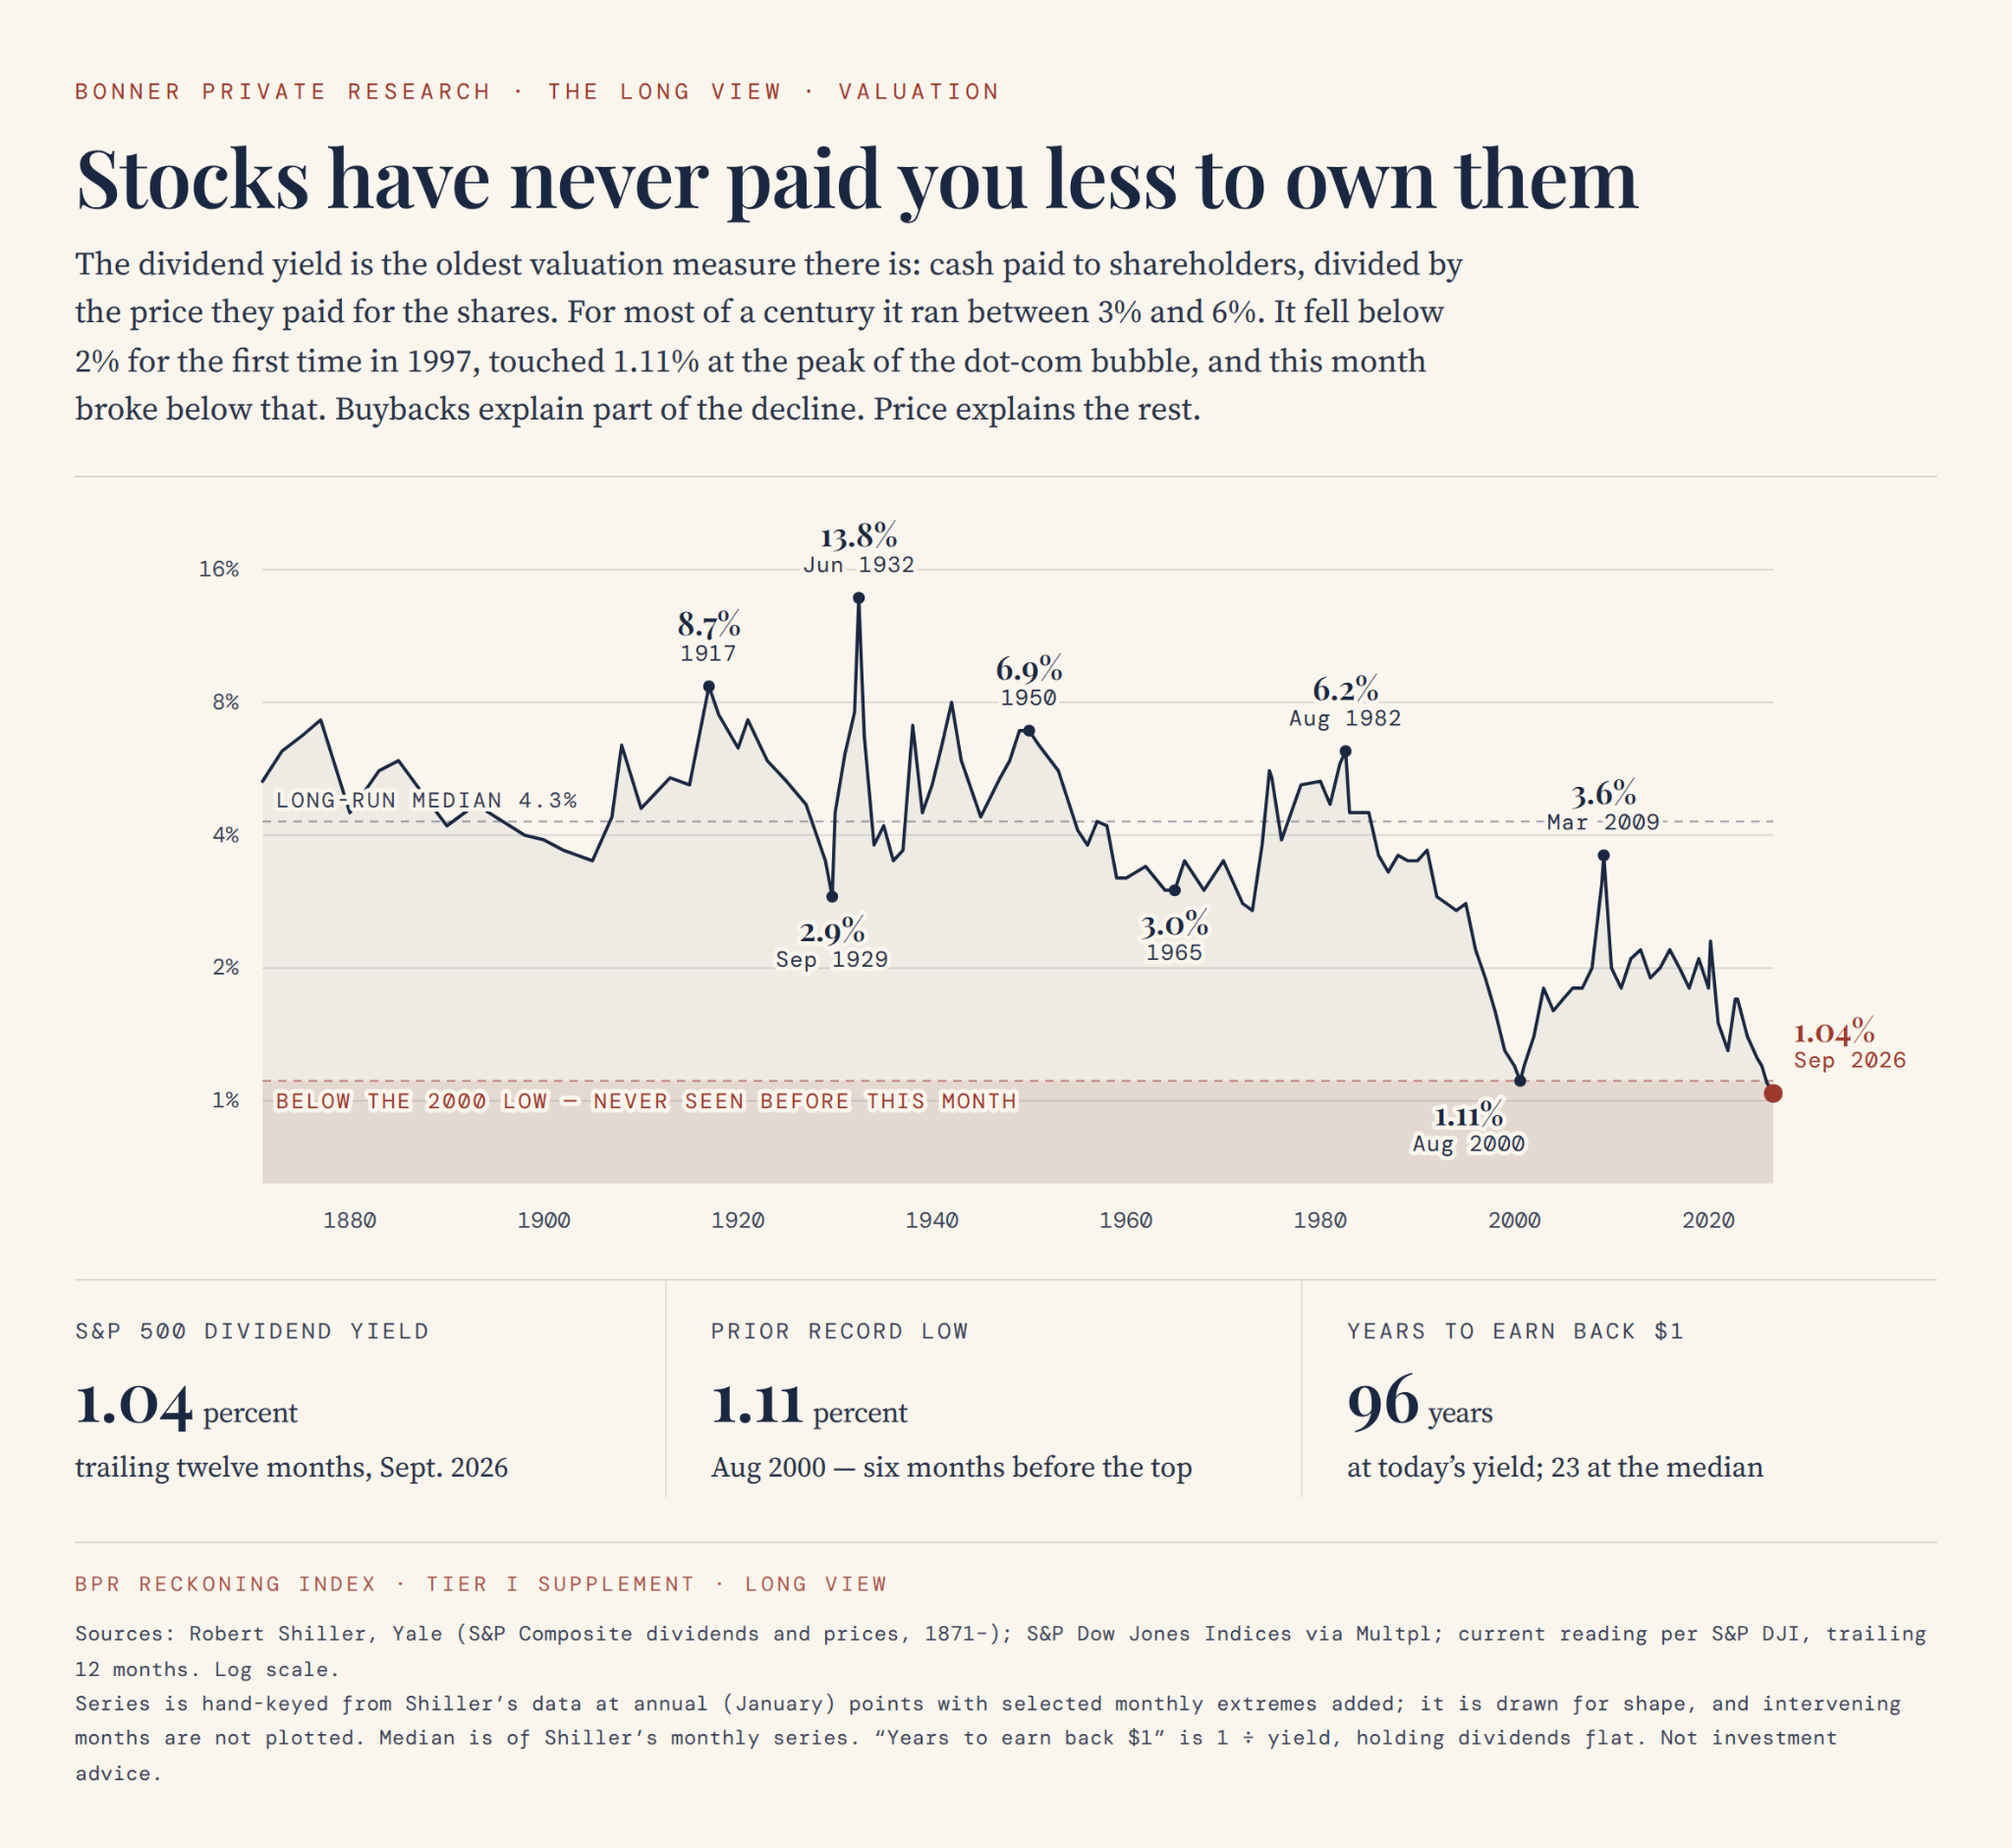
The dividend yield on the S&P 500–one of the regular valuation metrics we track–has made a new all-time low (you calculate the yield by dividing the trailing cumulative dividends of S&P 500 members by the value of the index). The current yield is 1.04%. The previous low was 1.11% (this is based on Yale Professor Robert Shiller’s data set, which goes back to 1871).
As you can see on the chart, the median level over the life of the American stock market is around 4.2%. Anything above 6% and the stock market index is making a new low (the exception was in 2009 when the yield peaked at 3.9% as the market bottomed). Anything below 2% and the market is at or near a peak in price terms.
All of which makes sense, in terms of price action. The yield goes down when the index is rising (price terms) but cash payouts by firms (dividends) are not. But the lower the yield goes, the more investors are expecting that ALL FUTURE RETURNS will come from capital gains. This is a problem. Why? See below.
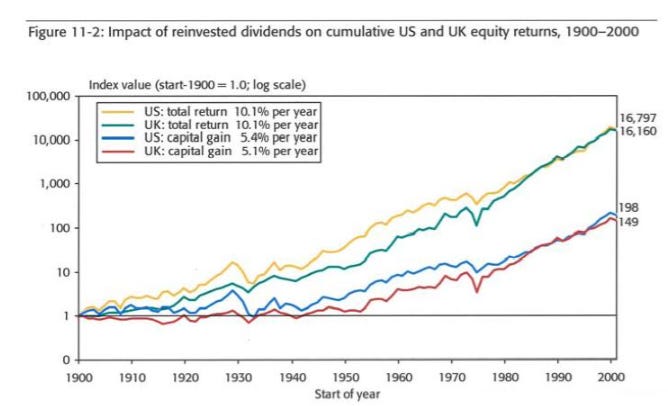
Reinvested dividends accounted for almost half of the total returns generated by US stocks from 1900 to 2000. This is according to the most comprehensive dataset of stock market returns, published in a book called Triumph of the Optimists. Capital gains come and go in waves. But reinvesting regular dividends is what gives compounding so much power over time.
When the dividend yield is low–as it is right now–it means investors are betting on capital gains doing all the heavy lifting in the years ahead. For this year, next year, the next decade, and probably the next 100 years. In big picture terms, you could say the record low dividend yield on the S&P 500 is a bet that high-tech/growth firms from America will be the best-performing investments of the foreseeable future.
Maybe they will!
Not much of the future is foreseeable. But are European companies going to do better? Can you invest in Chinese companies? Will Japan come back from the equity dead to rise again? Maybe.
But let’s not forget a point Investment Director Tom Dyson brought up earlier this week: the corrupting role of artificially low interest rates on asset prices. Artificially low interest rates support historically high stock valuations. Low rates raise the present value of future cash flows. So what?
For growth and tech companies–some of whom project higher cash flows a decade or more into the future–low rates lower the discount rate. The discount rate is the rate investors use to determine what future cash flows are worth right now. In other words, low rates create a massive bias to invest in high-growth/tech companies.
And that’s exactly what we’ve seen in the stock market. When the biggest and fastest growing companies in the stock market are tech companies, dividends don’t matter, do they?
What’s more, if you include stock buybacks as a kind of dividend, the ‘shareholder yield’ replaces the dividend dividend yield as a broader measure of how investors/owners receive cash from operators/management. You can ignore the warning signs, right?
No.
High growth…buybacks…an Intelligence Revolution where information and how it’s organized and analyzed is more important that the cost of labour, capital, or real resources….these are all arguments used to justify why…this time its different…and why an all-time low in the dividend yield on the S&P 500 does not necessarily mean stocks have made/will soon make an all-time high…before the historic mean revision begins.
Whatever. I present the numbers and facts. You decide. But I know what history shows.
There will come a time when investors are less sanguine about future cash flows. They will expect higher yields to compensate them for the risk of owning stocks. And they will begin to use a much higher discount rate, as the Primary Trend in interest rates is up…and headed higher. See the PS below for one final comment on dividends. But before that, check out this cool cat with his cool hat below.
