
High Tide
You could have run the Federal government with a surplus on $4 trillion in annual revenues for the entirety of American history up until the third quarter of 2015.

Saturday, July 26th, 2025
Laramie, Wyoming
By Dan Denning
Aaaaand we’re back. Back with real hot water, electricity, and some data and charts to put this distorted, inflated, and dangerous stock market in historical context. I know some readers found last week’s note and new Research Report (The Silver Report and the Fourth Taking) a little demoralizing.
Fear not!
For one, our Investment Director Tom Dyson is doing an excellent job of steering the ship on a steady course. Tom will have more to say in the August Monthly Strategy Report next Wednesday. We’re doing our best while we’re all subjects in the greatest monetary experiment in American history.
Second, history books are full of financial calamities befalling Americans. It’s nothing new. It’s just new for us…and something we have to prepare accordingly for.
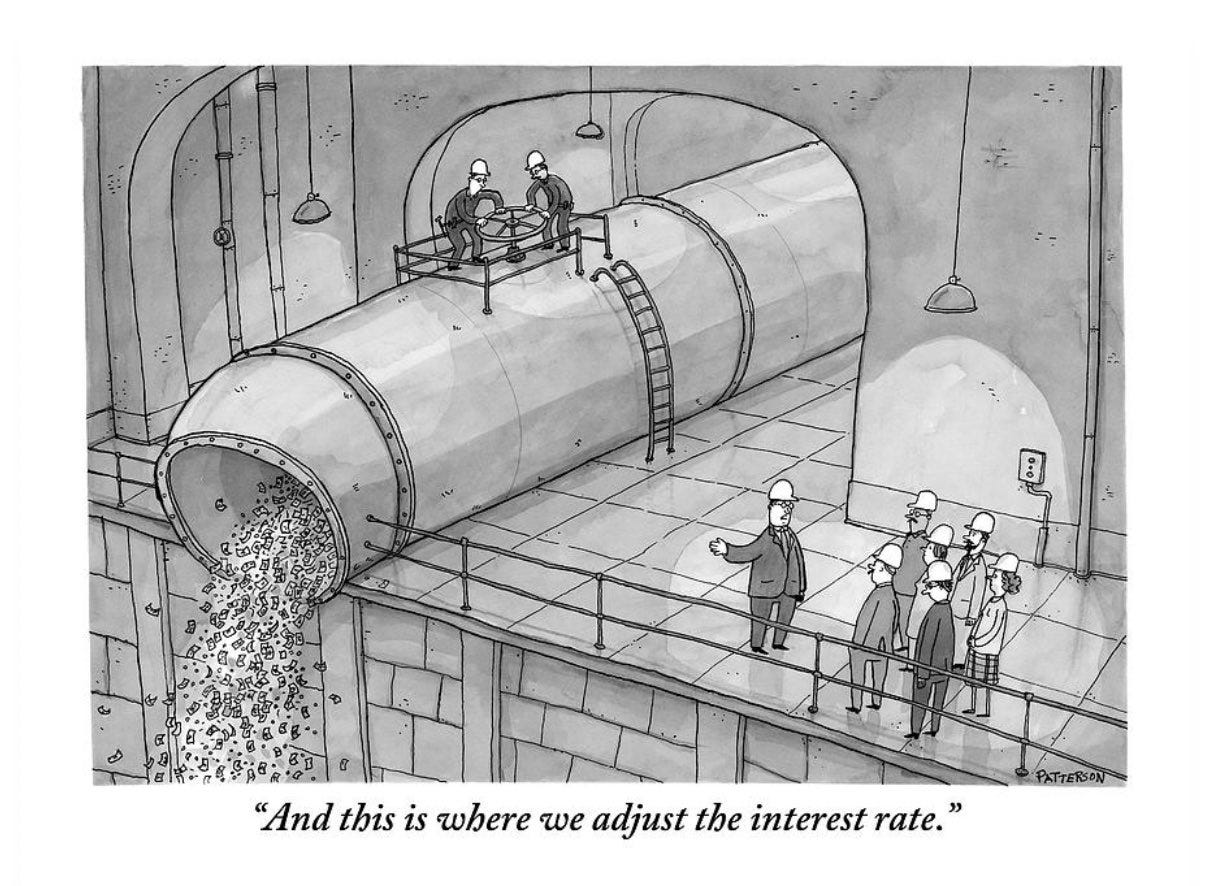
Third, the cartoon above helps put things in perspective with a little humor. Sometimes you just have to laugh and the insanity of all of it. Interest rates are a lousy tool for micromanaging a $30 trillion economy. Let’s end the Fed.
The Fed can open and close the money spigots. But it can’t really control where the money goes–if it is used productively and the capital is allocated to worthy projects that make the nation wealthier in the long-term…or if it goes straight into speculation in stocks and other financial assets. Let’s begin today by looking at earnings land.
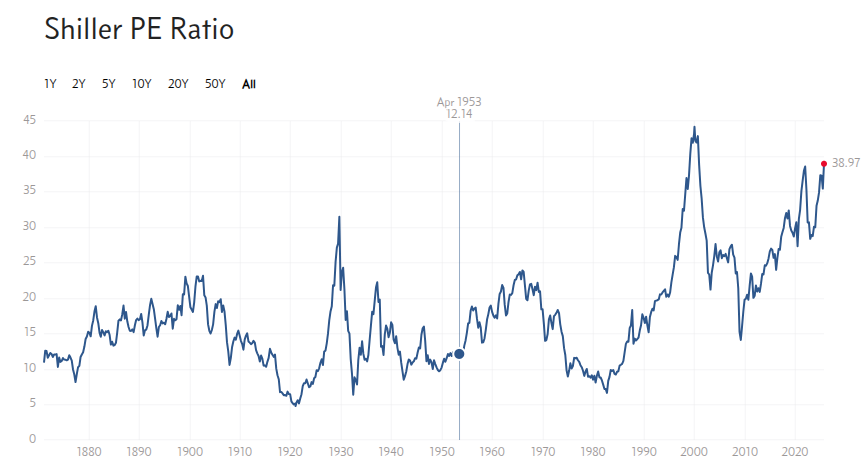
We talked about so many big ideas last week that I thought it would be a good idea to ground ourselves in historical numbers. We don’t know if there will be a ‘Fourth Taking’ that results in a new digital currency in America. But we do know that stocks have only been more expensive than they are now, relative to 10-year average earnings, one time in American history!
If you’re new to Bonner Private Research, we use Yale Professor Robert Shiller’s cyclically adjusted price/earnings ratio (CAPE) for two reasons. One, it uses an average of earnings on the S&P 500 over ten years. This ‘smooths out’ year-over-year volatility and gives you a better picture of the overall earnings trend than just using trailing twelve month earnings.
Second–and more importantly–when the ratio tells you that stocks are overvalued like they are now, it ALSO tells you what the earnings picture (and future returns) could look like over the next ten years (terrible, when you’re buying at these valuations). The December all-time high for CAPE was 44.19. Any ‘melt up’ on Fed rate cuts could take us past that. And then?
The ratio bottomed in April 1932 at 6.39. It bottomed again in April 1982 at 7.19. Both were excellent times to load up on ‘stocks for the long run.’ But you could only do that if you preserved your capital in the big draw-downs that followed a peak in CAPE. To take advantage of the fire sale, you must first avoid getting burned.
This is why we’re in Maximum Safety Mode and using the Dow/Gold ratio as our market timing measure for making the big switch out of gold and back into stocks. But wait! Aren’t we missing out on more potential upside? Shouldn’t we just hold our noses and buy? Take a look at the next chart.
