Fooled by Bidenomics
Fooled by Bidenomics
Deficits are especially important. If the government takes in $100 in tax revenues, and spends it, it removes that money from the consumer economy. No net increase to GDP.

Monday, April 1, 2024
Bill Bonner, reckoning today from Dublin, Ireland...
April Fool!
The inflation and GDP numbers are just ‘made up.’
Last week, the economic news, coming from inside the Beltway, was swell. MarketWatch:
GDP update boosts U.S. fourth-quarter economic growth rate to 3.4%
The final reading of U.S. growth in the 2023 fourth quarter was raised a few notches to a 3.4% annual pace, reflecting strong consumer spending and a surprisingly resilient economy.
The government previously said gross domestic product had expanded at a 3.2% rate in the final three months of last year. The figure is adjusted for inflation.
‘Adjusted for inflation’ is one of those expressions like, ‘we were only following orders;’ it can hide a mountain of mischief.
Over the last two years, we have often seen the inflation of the ’22-’23 period compared to the inflation of the 1970s. We have been told that today’s inflation rate peaked at 9% in 2022 and then came down quickly.
But if you measured today’s price increases the way they did in the ‘70s, you’d see that our current inflation is much worse today than it was then.
Marc Faber reports:
Former Secretary of the Treasury for President Clinton, Lawrence H. Summers, recently published a figure which showed that inflation had been and still was far higher than what the BLS had calculated…. Using the CPI as calculated before 1983, Summers estimated last year’s peak inflation at 18%. According to his methodology, interest rates would still be far too low. In other words, Bidenomics, with large fiscal deficits and negative real interest rates, would still be inflationary.
Are you thinking what we’re thinking?
If the inflation reading is false, so is the GDP rate. And so is the whole financial picture.
Let us begin with the measure of inflation itself. According to the Bureau of Labor Statistics (BLS), food rose (at an annual rate) of 2.7% last year; services went up 3.5%, and shelter rose 4.8%.
Already, we are deeply suspicious. Charlie Bilello reports:
The monthly mortgage payment needed to buy the median-priced home in the US has increased 80% over the last 4 years, moving from $1,500 per month to $2,700.
Between higher mortgage payments and higher house prices, an increase of only 4.8% for the cost of shelter seems almost impossible. But even taking the BLS numbers, it is hard to see how they could apply a ‘deflator’ of just 1.66%. Which is just proof that although numbers may not lie intentionally, if you torture them enough they will say whatever you want them to say.
And if you use the 1980 method of calculation, the whole picture of the US economy suddenly turns dark. Summers’ numbers show price increases through the end of last year running in the 10% to 12% range. Deflating the nominal GDP number, then, would give us a NEGATIVE growth rate of at least MINUS 7% — a huge loss in real GDP.
And what about the stock market?
When you get a ‘gain’ or a ‘profit’ from your stocks, you think you are better off. And now, everyone thinks the stock market has ‘recovered’ from its 2022 sell-off. But has it? A fair guess is that consumer prices are 25% higher than they were at the Dow peak in 2021. If so, the Dow would have to go to 45,000... just to breakeven.
Down in gold terms
We turn to gold to try to keep our story straight. From its peak at the end of 2021, to today, the Dow is up almost 4,000 points. But adjusted for the price of gold, it is still down nearly 10%.
Backwards? Forwards? Which way are we going?
Another curiosity of the GDP growth story is the role of fiscal deficits. If the government spends another billion dollars – even if it is frittered away on weapons – the amount is included as a plus in GDP. So, the more the feds spend, the higher GDP goes... at least in the short-run.
Deficits are especially important. If the government takes in $100 in tax revenues, and spends it, it removes that money from the consumer economy. No net increase to GDP.
But if it borrows the money, the extra spending it comes as if ‘out of nowhere’, and is added to the total. There is no offsetting draw-down in the consumer economy, so GDP goes up.
Last year, federal deficits were 6% of GDP. That was money that the feds spent, but didn’t raise from taxes. It must have gone somewhere. So, here’s a simple question:
How could the feds pump an additional 6% (of GDP) into the economy, with almost $3 trillion added to the national debt, but only get an increase of 3.4% (annualized from the fourth quarter) in GDP?
What happened to the other 2.6%? Where’s the missing $1.2 trillion? Where did the money go?
Does this mean that the real — non-government — economy is actually shrinking at such an alarming rate that it wipes out much of the feds’ new-money inputs?
Or are these numbers just so ‘made up’ that they are meaningless?
More tomorrow,
Bill Bonner
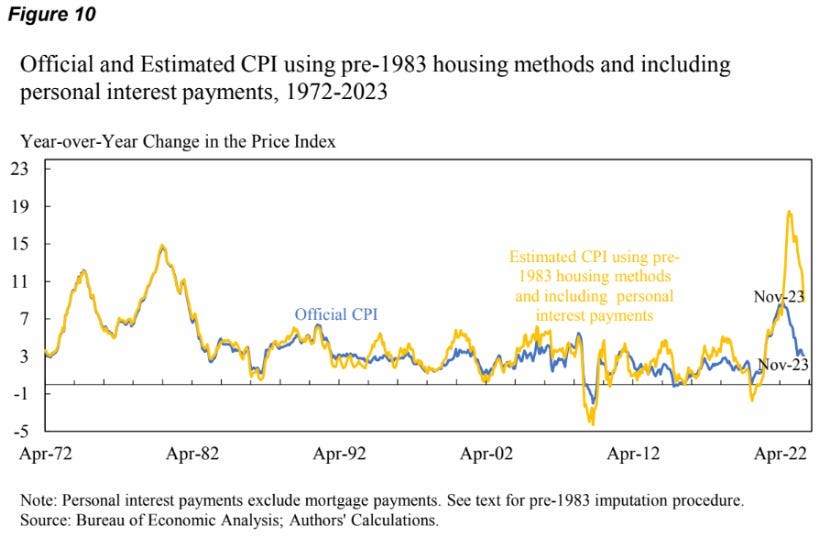
For more on the actual rate of inflation—including the rising cost of money itself—see the Weekly Update from March 15th, ‘Are you wearing a parachute?’ It includes the chart below, which shows that inflation is much higher than the official figures say. Here is a brief excerpt:
If you have any doubt that the price level in America has shifted permanently up in the last four years, look at the chart… It estimates the actual level of the consumer price index (CPI). It’s different from the current method for calculating CPI because it includes rising interest costs (on credit cards, auto loans, and mortgages) as part of the rise in prices.
As you can see from the chart above, this new method (which is the same method used before 1983, and is fair because people DO have to pay higher interest costs) shows inflation peaking at around 18% in 2022. The official ‘peak’ was 9%. The paper’s authors reckon that late last year, the alternative (or actual) method of calculating CPI was about 6% higher than the ‘official’ figure.
You can read the study here. But if you’re not a masochist, I’ll save you the trouble. It’s all in the title: The cost of money is part of the cost of living.