
Fat Bears and Super Moons
The assets into which that liquidity might flee–precious metals, energy, real asset companies–are small in relation to the incoming volume. That’s a powerful force for much higher prices.


Friday, October 3rd, 2025
Laramie, Wyoming
By Dan Denning
G’day mate!
It all feels very Australian this week. That is, the action in rare earths, lithium, and uranium reminds me of the bee-hive of activity during the commodity boom twenty years ago. I spent the best ten years of that boom in Melbourne, writing and publishing research on what was happening and how to invest and profit from it.
It’s different this cycle. Back then, it was fixed asset investment directed by the Chinese communist party driving up demand for commodities. Supply cannot react overnight to trillions of dollars of State-directed and private sector investment. The result is rising prices until investment comes on-stream to increase output.
Boom. Bust. Repeat. The cycle. And this time?
Today’s commodity rally is driven by long-term trends in the decline of the US dollar. It’s also driven by the US realizing, belatedly, it’s become dependent on foreign producers for metals and minerals that are critical to the US military. It’s become a national security investment story. And it got a lot more interesting this week.
In today’s update, I’ll show you how one of the lesser known cycles in economic thought tells us where we are today. I learned it from Lord William Rees-Mogg working in London in the early part of this century. It speaks directly to the massive over-investment in AI, the investment bust that must result, and what all that productive capacity might someday be used for. But let’s begin with the big picture.
You’re lucky if you live through one manic market. To have two in the first 25 years of the same century is extraordinary. Each week brings a new high on an old valuation metric. And every time we see a new high, we know we’re closer to mean reversion.
Bill mentioned two new highs this week. First, the 3.39 price-to-sales ratio on the S&P 500. The previous high was 3.04 in December of 2021. A correction followed. And it would likely have continued if ChatGPT hadn’t come on the scene in November of 2022. That kicked off the frenzy we find ourselves in now, staring back from dizzy heights of valuation.
The other metric Bill mentioned was the Cyclically Adjusted Price Earnings (or CAPE) ratio invented by Yale economist Robert Shiller. CAPE takes earnings over ten years to create an average. This ‘smooths out’ year-to-year volatility to give you a bigger picture. CAPE is 40.08 now. It was 44.19 in December 1999.
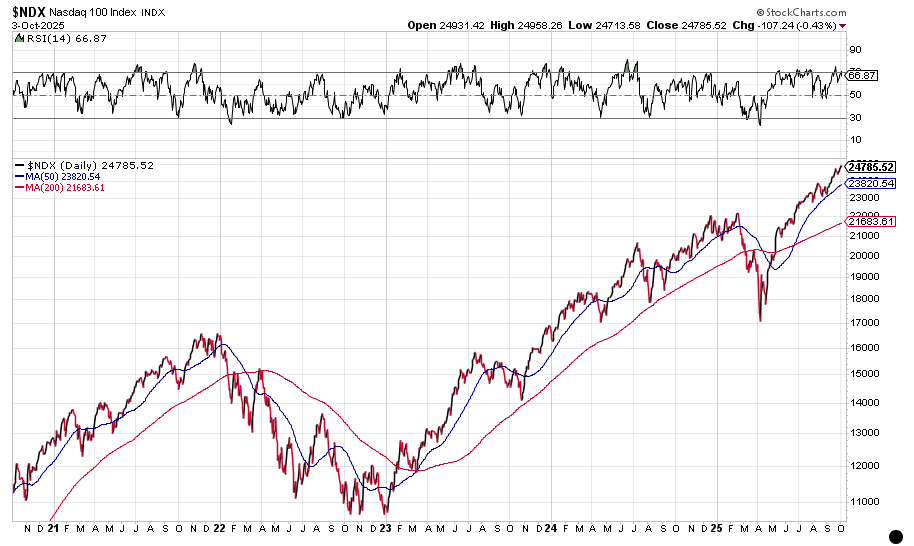
Stocks can and do trade well above their valuations for years on end. The last three years tell that tale. The chart above shows the Nasdaq 100 Index [NDX] over the last five years. I look at it from time to time to check if there are any technical indications that a change in trend is imminent. The RSI is just below 70 (over-bought).
But note the spread between the short-term and long-term moving averages (the blue and red lines). The wider the spread…the further the rubber band is being stretched. Watch for the snap back…and mind the gap. Now to gold.
