


Sunday, October 25th, 2026
Laramie, Wyoming
By Dan Denning
‘Follow the money.’
That’s what ‘Deep Throat’ tells Woodward and Bernstein in the 1976 movie ‘All the President’s Men.’ The line was made up by a screen writer. But Deep Throat was real. It was Mark Felt, who’d been passed over for the Director’s job at the FBI in 1972 (after J. Edgar Hoover’s death).
Felt was the Associate Director at the time (second in charge at the Bureau) and later confessed he was worried about Nixon’s obstruction of the FBI’s investigation into the Watergate burglarly. He died in 2008.
All ancient history, but good advice when it comes to following the money. On Friday, Meta joined Alphabet in being the latest ‘hyperscaler’ to report negative free cash flow on a quarterly basis. For Alphabet (Google) it was Q2. For Meta, Q3. Sales and operating cash flows for both firms are still healthy. But it’s all that cap ex spending on AI which results in negative free cash flow. What now?
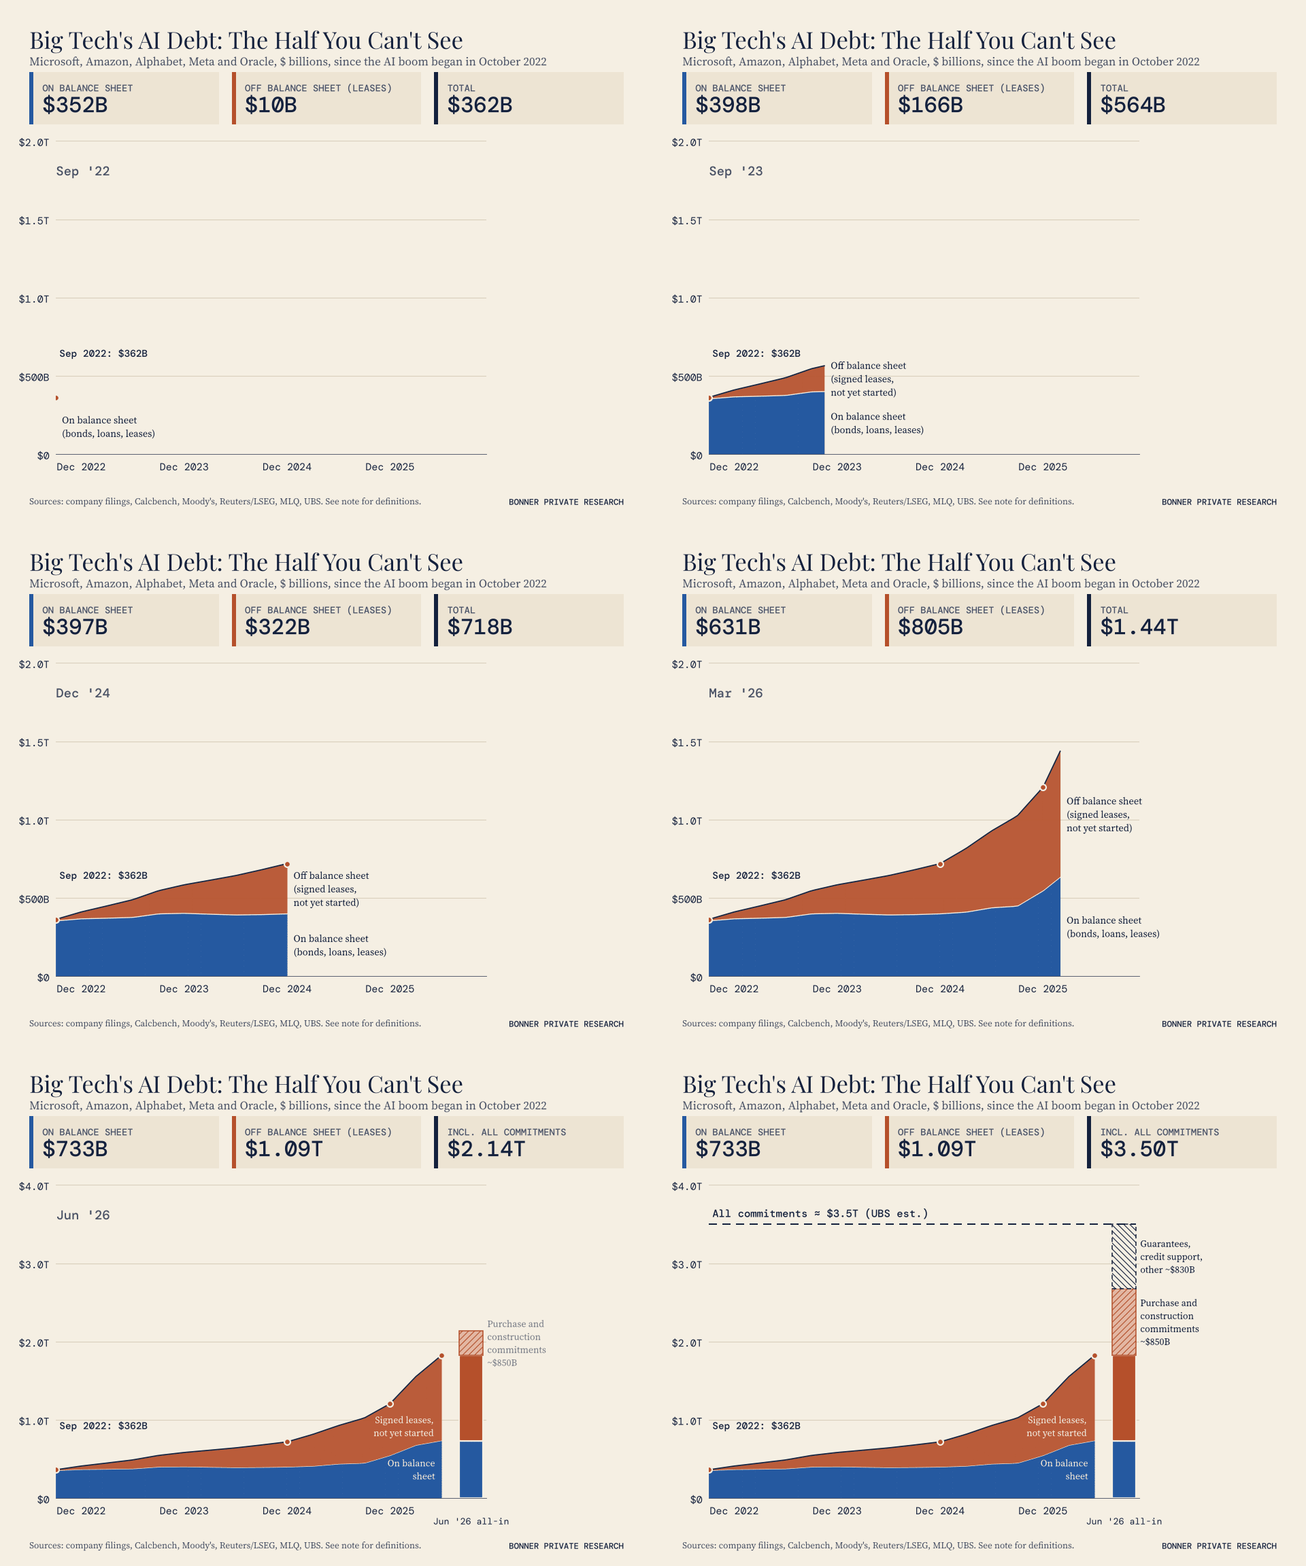
Even when interst rates were historically low, money wasn’t entirely free. Depending on how you add it up, the hyperscaers have been $700 billion and $3 trillion debt. The lower figure is based on based things that are strictly debt. The higher figure—which includes ‘off balance sheet’ items—includes purchase committents, guarantees, and construction costs (all of which can, of course, be scrapped or reduced if the cash isn’t flowing).
You wonder if there are enough data centers to put all those chips in. You wonder if there’s enough copper to build all those data centers (or at what price). You wonder if there’s enough electricity to power them, assuming they were built. And you wonder if the political environment for all this is about to become a lot more toxic after the mid-term elections on Tuesday, November 3rd.
Those are problems for another day (nine days for the mid-terms). For now, the broadest definition of AI-related stocks puts their total market value at 49% of the total value of the S&P 500. As capex booms go, that’s second only to railroad boom in 1881, where the figure peaked at 63% (it was 36% for Industrials/Utilities in 1929, 40% for the ‘Nifty Fifty’ in 1972, 44% for Japan in 1988, and 41% for the dot.coms in 1999).
All those booms went bust. This one will too. The ‘hyperscalers’ can sell new equity to finance continued capex. But if they do, investors will start to wonder when all this investment is going to pay off…or IF it is going to pay off.
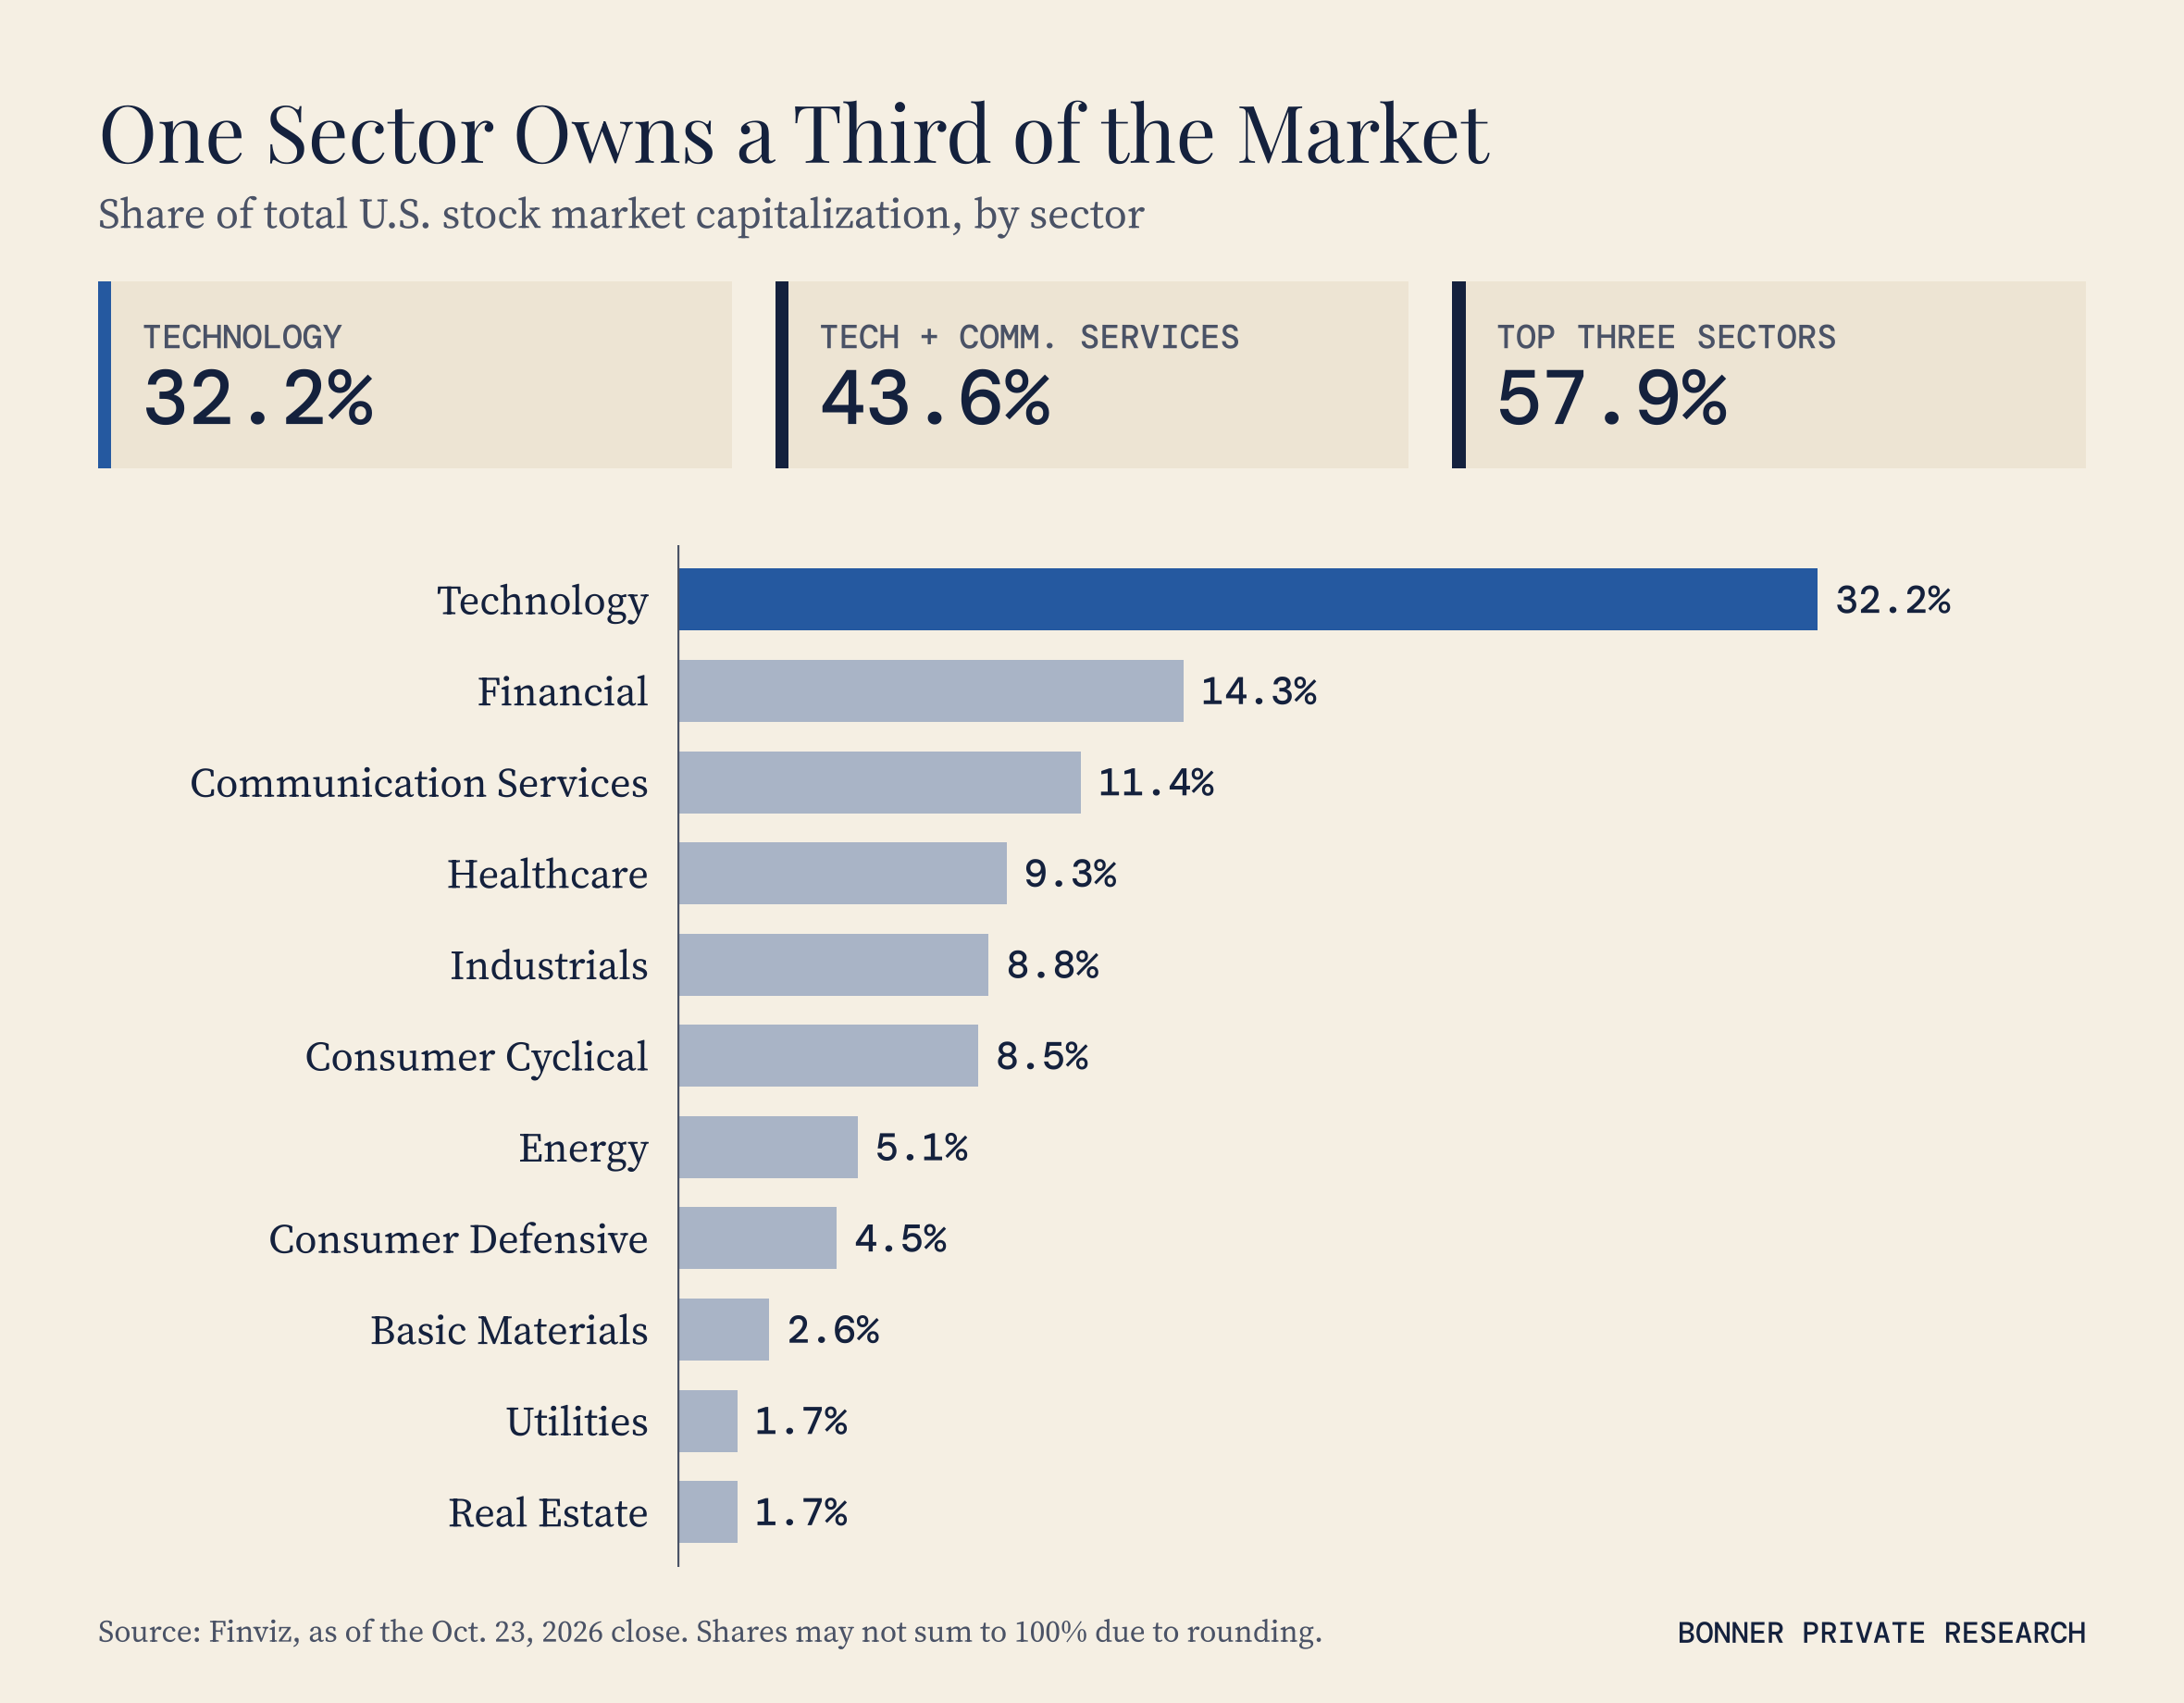
But it’s a big stock market out there. There are over 5,611 publicly listed US stocks. Over 1,00 of them are healthcare/biotech/pharma. There are 950 financial firms, 800 tech firms, 650 industrial firms, 600 consumer cyclical firms, 260 energy firms, 240 real estate firms, 240 consumer defensive firms, 220 basic materials firms, and 180 communication companies.
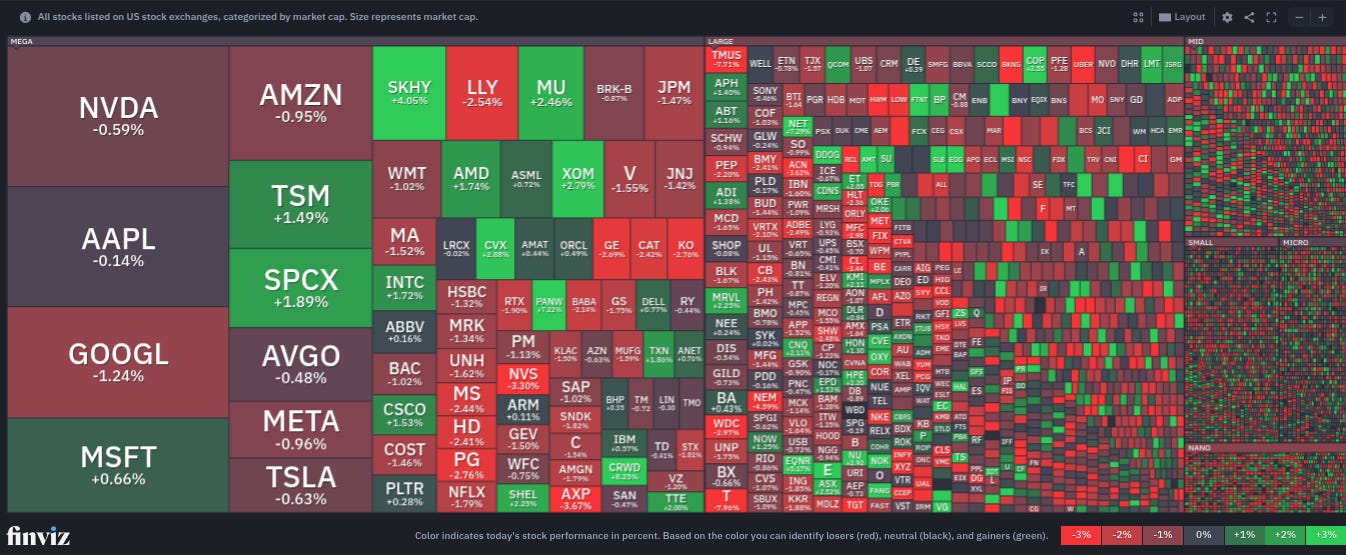
The chart at the top of today’s letter shows how the ten largest companies dominate, in terms of market cap. They get all the liquidity, especially from passive investment vehicles that allocate capital based on size. Easy come. Easy go. The chart below breaks it down further by sector (this is for the entire US market, not just the S&P 500).
What does all this mean?
It means after the ‘Big Loss’—which history tells us is inevitable in markets where mean reversion is at work—you’ll have all lot of choices about what to do with your money. Our mandate is to make sure you still have that money…and then help you make those choices (energy and basic materials are historically under-owned by Wall Street).
Paid up readers can read more on Wednesday, when BPR Investment Director Tom Dyson publishes the November Monthly Strategy Report. For new readers, that’s the fastest way to get up to speed with the ‘big picture’ as we see it. If you’re not a paid reader yet…why not?
In the meantime, below you’ll find all the best research published in the last week by BPR.
Until tomorrow,
Dan


You might want to proof read before hitting “print”.