
AGI's Dirty Little Secret

Friday, May 8th, 2026
Laramie, Wyoming
By Dan Denning
Today is the 81st anniversary of VE Day. Victory in Europe over the Nazis. VJ Day, victory over Japan, would come in August of 1945. But it’s worth remembering today. The entire post-war arrangement that’s shaped modern Europe is changing. The Axis of Energy and Information–or what countries have Energy Sovereignty–may determine who the next superpowers are.
I’ll come back to that. It gets back to the theory of ‘Megapolitics’ set out by James Dale Davidson and the late Lord William Rees-Mogg in their books The Great Reckoning and The Sovereign Individual. We’ll have a look at the important parts they got right about geography and liberty. And what they may have gotten wrong about technology and centralization and tyranny.
But first take a look at the chart below. It’s our usual representation of the ratio between financial assets (represented by the S&P 500) and commodities (represented by the CRB index). In an ‘Inflationary Bust’ scenario like Investment Director Tom Dyson laid out in the May Monthly Strategy Report, you’d expect stocks to fall and commodities to rise. What then?
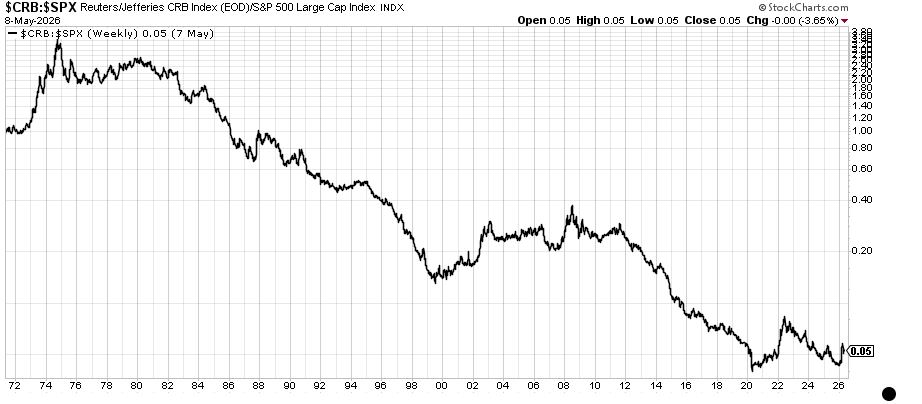
The ratio would rally off its double bottom and a whole variety of commodities would rise in price. That’s what happened in the early 1970s when the first Arab oil embargo sent energy prices sky high (with some delay between higher oil prices and higher commodity prices). Today, there’s another lag between the interruption of oil transiting the Strait of Hormuz and higher inflation. For how long, though?
In the meantime, the multi-year ‘supercycles’ in commodities that result from decades of under-investment in exploration and production are clearly evident on the chart. The CRB outperformed the S&P 500 from roughly 2000 to 2012. That period began with stocks at all-time highs in terms of valuations, just like today.
There have been other ‘spikes’ in the ratio like in the early 1970s and 2020-2022. Those were the results of either big sell-offs in stocks (The Big Loss) or big rallies in precious metals and energy. For a longer rally in the ratio, where commodities outperform stocks for five to ten years, you need sustained bull markets across the commodities complex. Is that likely?
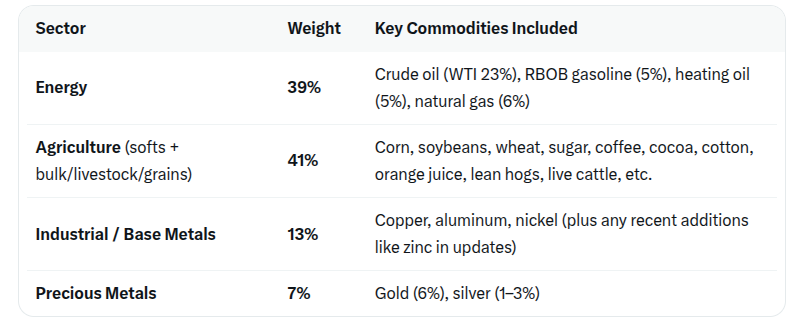
The table above shows the four major sectors tracked by the CRB and their respective weightings. It’s notable that precious metals are such a small allocation to the total index. This is likely because gold is more of a monetary metal than an industrial commodity. And that silver is a relatively small (but important) industrial sector in the scheme of things.
Agriculture has a larger weighting than energy. But they are not un-related. Higher energy costs (or shortages of agricultural inputs derived from crude oil) are going to drive up ag prices in a worst-case scenario this summer. We haven’t really seen a move yet, though, in softs/bulk/grains/and livestock.
This all crossed my mind earlier this week when I filled up my chest-freezer with ground beef and steaks from the local butcher. It’s a little frozen food bank for a summer of uncertainty. As long as I can keep the power on (with a back up generator) I won’t go hungry. But how likely is anyone in America to go hungry this summer?
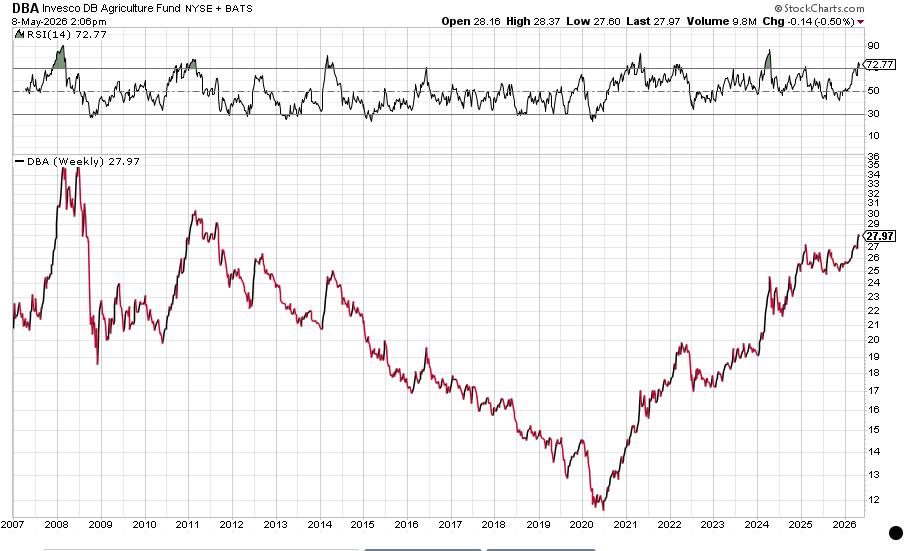
DBA, the Invesco DB Agriculture Fund, has been a proxy for grains and commodities since it came out in early 2007. It became popular as a liquid proxy in the stock market for higher commodity prices, particularly food. The stock market crash in 2008 took some wind out of its sails. But it’s still a convenient way to go ‘long’ agricultural commodities.
Remember the Arab Spring? That began in 2011 with a Tunisian fruit vendor setting himself on fire in protest of unfair government regulation and taxation (this is something I have yet to see a ‘No Kings’ protestor do). The food crisis in the Middle East became a genuine geopolitical crisis. Price signals…signalled that something bigger was happening. Regimes fell and changed.
DBA bottomed during Covid. It’s climbed higher since. And now it’s now working its way to a new 15-year high. If Tom’s inflationary bust scenario plays out this year, DBA may make higher highs from here on out. Let’s take a closer look at the weightings in the index it tracks (DBA constructs its return using futures contracts).
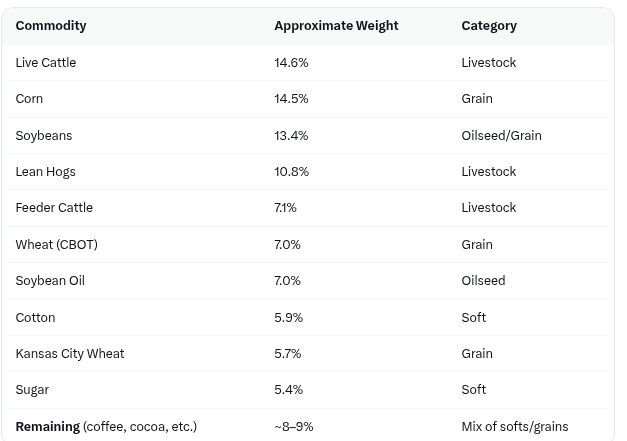
Livestock and grains dominate. Corteva [CTVA], Bunge [BG], Archer-Daniels-Midland [ADM], Nutrien [NTR], and Tyson Foods [TSN] are all large-cap stocks with exposure to ag prices worth keeping an eye on (they are nearly all trading at 52-week highs right now). You could also look at which countries produce the most soft commodities and then see if the performance of country-based ETFs (Brazil, Canada, Australia), correlates with higher food prices.
Of course the most direct route–if your aim was a financial profit–would be to speculate in the commodity markets directly. Since that is not our game at BPR, I won’t further elaborate on it. I would only add that the most sensible thing to do is to stock up on rice, pasta, and sugar in your own home. As Bill always says, panic now and avoid the rush.
It’s always possible–though we think unlikely–that the Hormuz energy interruption is peacefully resolved AND that oil prices decline dramatically from here. A combination of lower energy prices AND lower interest rates might then push us back into the ‘Inflationary Boom’ quadrant Tom mentioned last month. Which leads to an obvious question: Are we prepared for that and how will our strategy perform under different scenarios?
